Connect with us

News

2 adults dead, 3 children injured in Bristol crash

Published

on

2 adults dead, 3 children injured in Bristol crash

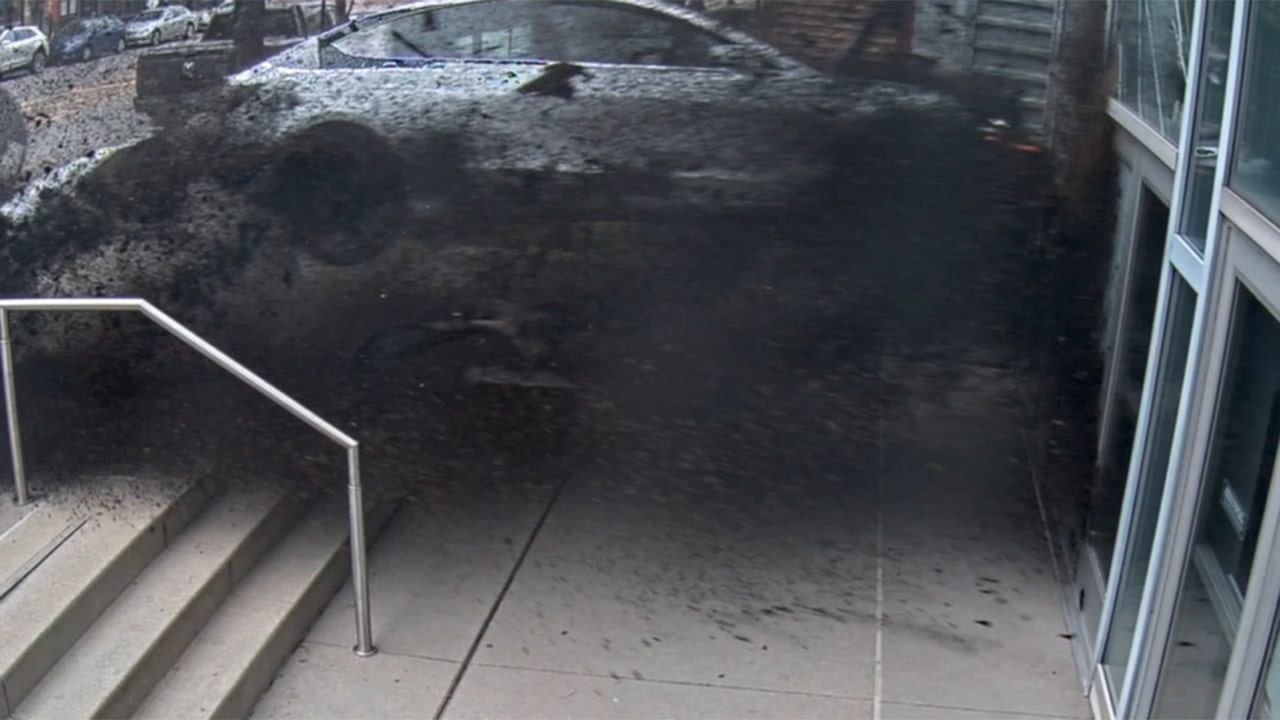
BRISTOL, Conn. (WFSB) – Two adults have died and three children have been injured after a serious crash in Bristol.

The crash took place on Stevens Street near the Farmington town line at 7:18 p.m.

The vehicle struck a tree.

Fire officials found five victims were trapped in the vehicle, with two adults dead on arrival, according to Bristol Fire Chief Richard Hart.

Three children had to be extricated from the vehicle.

Advertisement

One child was Lifestarred to Connecticut Children’s Medical Center.

The other two children were transported to area hospitals by ambulance.

Police have yet to release the ages of the people involved in the crash or the condition of the children.

This story is breaking. Eyewitness News has a crew heading to the scene.

Advertisement
Continue Reading
Advertisement
Click to comment

Leave a Reply

Your email address will not be published. Required fields are marked *

This site uses Akismet to reduce spam. Learn how your comment data is processed.

News

Moldova’s wineries shift away from Russian gas

Published

on

Moldova’s wineries shift away from Russian gas

Unlock the Editor’s Digest for free

Wineries in the small eastern European country of Moldova are increasingly turning to renewable energy as part of the nation’s westward shift and efforts to curb its reliance on Russian gas.

Cricova, founded in 1952 by a Soviet decree that bears the signature of Joseph Stalin, is one of the vineyards that reduced its energy costs by 25 per cent after building solar parks and improving its insulation.

“All of the wine production process has been modernised . . . as we are adapting to today’s consumers and global trends”, said Cricova director Sorin Maslo.

Advertisement

After Russia’s full-scale invasion of neighbouring Ukraine, Moldova accelerated its westward shift, applying for EU membership and looking for alternative energy sources to the Russian state-owned giant Gazprom.

Winemakers — a significant sector of the country’s economy — followed suit and started installing solar panels and insulating their facilities to reduce energy consumption. Cricova also pulled from public display Vladimir Putin’s wine collection of 607 bottles which the Moldovan government gave the Russian leader when he visited in 2008.

Moldova’s energy ministry estimates that last year households and businesses tripled their renewable energy sources, particularly photovoltaics.

Smaller businesses such as the new vinery Luca have also benefited from state subsidies to go green.

The owner Ion Luca told the Financial Times he avoided gas from the outset, when construction started in 2018, by investing in insulation and an electricity-powered heat pump at his winery in the town of Cricova, near the eponymous state company.

Advertisement

“We were Gazprom’s hostages and I did not want to depend on them,” Luca said.

Luca, who is part of the fourth generation of winemakers in his family, said that when the Soviets annexed Moldova in 1944, his grandparents lost their house, their vineyards and all other properties. They were labelled “enemies of the people” and sent to Siberia in 1949 as part of one of Stalin’s mass deportations.

After Stalin’s death, his family returned to Moldova, and his father helped set up the wine production at the Soviet winery in Cricova the dictator had ordered, but the Lucas never got their land back. In 2018, Ion Luca purchased his new vineyard which aims to be “the most sustainable winery” in Moldova.

Winemakers, which are a significant sector of Moldova’s economy, started installing solar panels and insulating their facilities to reduce energy consumption after Russia invaded its neighbour Ukraine © Purcari winery/Dreamstime

Purcari, a Moldovan brand that has a strong presence on western markets after turning its back on Russia, is also going green.

Vasile Tofan, chair of the board of Purcari, said the shift was prompted by Russia’s repeated wine embargoes in the 2010s when Moscow sought to squeeze Moldova into cheaper deals.

Advertisement

“Fool me once, shame on thee, fool me twice, shame on me,” said Tofan. The Russian bans initially put Purcari “on our knees” but eventually proved “a blessing in disguise” as it accelerated the westward pivot.

In 2014, when Russia annexed Crimea, Purcari produced “a liquid manifesto”, Freedom Blend, a wine made from Crimean, Georgian and Moldovan grape varieties. Purcari has since become a staple at festivals in neighbouring Romania and is available in the UK, Germany, Poland, as well as online.

Since 2021, Purcari has managed to cover a third of its energy consumption using solar panels. Tofan told the FT that the shift was bound to happen because Russia had been throttling Moldova’s gas supply and imposing price rises long before invading Ukraine, with the war just the latest catalyst for this transition.

Cricova, Luca and Purcari are also trying to make their business more sustainable by investing in lighter bottles, given that the biggest share of the industry’s carbon footprint is generated by producing and transporting heavy glass bottles. Luca also exports bag-in-box wines to Scandinavian markets.

A focus on wine quality and the revival of local varieties, which were lost in the Soviet era, can also boost exports, said Diana Lazăr, senior wine director at the international development company Chemonics.

Advertisement

Russia’s squeeze on the Moldovan economy “galvanised the transition to a more sustainable business model which does not just use cheap resources and can become a competitive advantage in the long run”, said Lazăr. “This way, the Moldovan winemakers are aligning themselves to the global trend.”

Continue Reading

News

Harris releases her medical report — and uses it to raise questions about Trump

Published

on

Harris releases her medical report — and uses it to raise questions about Trump

Vice President Harris takes questions from reporters at Joint Base Andrews in Maryland on Oct.12, 2024.

Brendan Smialowski/AFP


hide caption

toggle caption

Advertisement

Brendan Smialowski/AFP

Vice President Harris on Saturday released a medical report — a document that her campaign is using to draw a contrast with her older rival — and dared former President Donald Trump to do the same.

This is the first time Harris, 59, has released results of a physical. Similar to reports released by previous commanders-in-chief, the two-page letter says that Harris is in excellent health and has “the physical and mental resiliency required to successfully execute the duties of the presidency.”

Harris told reporters traveling with her that every candidate for president had released medical information “except Donald Trump in this election cycle.”

Advertisement

“It is clear to me that he and his team do not want the American people to really see what it is that he is doing and whether or not he actually is fit to do the job of being president of the United States,” she said.

Trump released a three-paragraph letter about his health a year ago

This medical disclosure come as Harris and Trump seem locked in a tie, less than a month before Election Day — each looking for ways to shake up the race and win over the small number of undecided or persuadable voters in swing states.

Harris’ campaign has been raising questions about whether Trump, 78, is up to the job, drawing attention in particular to his rambling and disjointed speeches as a sign that he has slipped.

“He talks at his rallies about fictional characters. He constantly is in a state of grievance about himself,” Harris said on Saturday, rhyming off a list of failings. “He is quite unfit to do the job,” she said.

Trump in Nov. 2023 released a three-paragraph letter from a doctor about his health. It said Trump’s “overall health is excellent” and that his “cognitive exams were exceptional.”

Advertisement

On Saturday, Trump spokesperson Steven Cheung said that the former president had voluntarily released information over the years that showed “he is in perfect and excellent health to be commander in chief.”

Trump’s health has been a subject of speculation since he first released a short statement as a candidate in 2015 that said he would be “the healthiest individual ever elected” to the office — a letter that his then-doctor later said that Trump himself had dictated. The veracity of subsequent reports were also widely questioned.

When President Biden, 81, was still running for a second term, stumbles, mumbles and mistakes drew headlines and his age became his greatest political liability with voters, while Trump’s age and acuity came under less scrutiny.

After he was seemingly overwhelmed during his June debate with Trump, Biden was pressured by his party to bow out and pass the torch to a younger leader.

Here are some highlights from Harris’ medical report

Dr. Joshua Simmons, a White House Medical Unit physician who has been Harris’ doctor since Jan. 2021, wrote the three-page report. He said.

Advertisement
  • Harris has seasonal allergies and has been on allergen immunotherapy to reduce her symptoms. She occasionally uses Atrovent but has never experienced severe symptoms, angioedema or anaphylaxis, her doctor said.
  • She is nearsighted and wears contacts, but can read comfortably without contacts or glasses.
  • Her most recent physical exam was in April 2024. She is up-to-date on preventive care like colonoscopy and annual mammograms. She takes a Vitamin D3 supplement.
  • She is at low risk for atherosclerotic cardiovascular disease.
  • She works out daily and eats healthy; does not smoke and drinks only occasionally and in moderation.
Continue Reading

News

Toplines: October 2024 Times/Siena Poll of Registered Voters in Arizona

Published

on

Toplines: October 2024 Times/Siena Poll of Registered Voters in  Arizona

How These Polls Were Conducted

Here are the key things to know about this set of polls from The New York Times, The Philadelphia Inquirer and Siena College:

• Interviewers spoke with 808 voters in Arizona from Oct. 7 to 10, 656 voters in Montana from Oct. Oct. 5 to 8, and 857 voters in Pennsylvania from Oct. 7 to 10.

• Times/Siena polls are conducted by telephone, using live interviewers, in both English and Spanish. Overall, more than 95 percent of respondents were contacted on a cellphone for these polls.

• Voters are selected for the survey from a list of registered voters. The list contains information on the demographic characteristics of every registered voter, allowing us to make sure we reach the right number of voters of each party, race and region. For these polls, interviewers placed about 235,000 calls to nearly 90,000 voters.

Advertisement

• To further ensure that the results reflect the entire voting population, not just those willing to take a poll, we give more weight to respondents from demographic groups that are underrepresented among survey respondents, like people without a college degree. You can see more information about the characteristics of our respondents and the weighted sample at the bottom of the page, under “Composition of the Sample.”

• The margin of sampling error among likely voters is about plus or minus four percentage points. In theory, this means that the results should reflect the views of the overall population most of the time, though many other challenges create additional sources of error. When the difference between two values is computed — such as a candidate’s lead in a race — the margin of error is twice as large.

If you want to read more about how and why the Times/Siena Poll is conducted, you can see answers to frequently asked questions and submit your own questions here.

Full Methodology

Advertisement

The New York Times/Siena College polls of 656 voters in Montana and 808 voters in Arizona and the New York Times/Philadelphia Inquirer/Siena College poll of 857 voters in Pennsylvania were conducted in English and Spanish on cellular and landline telephones. The Arizona ran from Oct. 7 to 10, the Pennsylvania poll ran from Oct. 7 to 10, 2024, and the Montana poll ran from Oct. 5 to 8.

For each poll, the margin of sampling error among the likely electorate is plus or minus 4.3 percentage points in Montana, plus or minus 3.9 percentage points in Arizona and plus or minus 3.8 percentage points in Pennsylvania.

The Times/Siena polls of Pennsylvania in 2024 were conducted in partnership with the Philadelphia Inquirer and were funded in part by a grant from the Lenfest Institute for Journalism. The poll was designed and conducted independently from the institute.

Sample

The survey is a response-rate-adjusted stratified sample of registered voters taken from the voter file maintained by L2, a nonpartisan voter-file vendor, and supplemented with additional voter-file-matched cellular telephone numbers from Marketing Systems Group. The sample was selected by The New York Times in multiple steps to account for differential telephone coverage, nonresponse and significant variation in the productivity of telephone numbers by state.

Advertisement

To adjust for noncoverage bias, the L2 voter file for each state was stratified by statehouse district, party, race, gender, marital status, household size, turnout history, age and homeownership. The proportion of registrants with a telephone number and the mean expected response rate were calculated for each stratum. The mean expected response rate was based on a model of unit nonresponse in prior Times/Siena surveys. The initial selection weight was equal to the reciprocal of a stratum’s mean telephone coverage and modeled response rate. For respondents with multiple telephone numbers on the L2 file, or with differing numbers from L2 and Marketing Systems Group, the number with the highest modeled response rate was selected.

Fielding

The sample was stratified according to political party, race and region. Marketing Systems Group screened the sample to ensure that the cellular telephone numbers were active, and the Siena College Research Institute fielded the poll, with additional fieldwork by ReconMR, the Public Opinion Research Laboratory at the University of North Florida, the Institute for Policy and Opinion Research at Roanoke College, the Center for Public Opinion and Policy Research at Winthrop University in South Carolina and the Survey Center at University of New Hampshire. Interviewers asked for the person named on the voter file and ended the interview if the intended respondent was not available. Overall, more than 95 percent of respondents were reached on a cellular telephone.

In Arizona and Pennsylvania, the questions were translated into Spanish by ReconMR. Bilingual interviewers began the interview in English and were instructed to follow the lead of the respondent in determining whether to conduct the survey in English or Spanish. Monolingual Spanish-speaking respondents who were initially contacted by English-speaking interviewers were recontacted by Spanish-speaking interviewers. Overall, 6 percent of interviews (9 percent of the weighted sample) among self-reported Hispanics were conducted in Spanish, including 2 percent of the interviews (3 percent of the weighted sample) among self-reported Hispanics in Arizona and 26 percent of the interviews (34 percent of the weighted sample) among self-reported Hispanics in Pennsylvania.

An interview was determined to be complete for the purposes of inclusion in the questions about whom the respondent would vote for if the respondent did not drop out of the survey after being asked the two self-reported variables used in weighting — age and education — and answered at least one of the questions about age, education or presidential-election candidate preference.

Advertisement

Weighting (registered voters)

The survey was weighted by The Times using the survey package in R in multiple steps.

First, the sample was adjusted for unequal probability of selection by stratum.

Second, each poll was weighted to match voter file-based parameters for the characteristics of registered voters.

The following targets were used:

Advertisement

• Party registration (L2 data) by whether the respondent has requested an absentee ballot for the 2024 general election (L2 data), in Pennsylvania

• Party registration (L2 data) by race (L2 model), in Arizona

• Six categories of partisanship (Classification based on an NYT model of vote choice in prior Times/Siena polls), in Montana

• Partisanship (L2 model based on commercial data and partisan political contributions), in Montana

• Race or ethnicity (L2 model)

Advertisement

• Age (self-reported age, or voter-file age if the respondent refused) by gender (L2 data)

• Education (four categories of self-reported education level, weighted to match NYT-based targets derived from Times/Siena polls, census data and the L2 voter file)

• White/nonwhite race by college or noncollege educational attainment (L2 model of race weighted to match NYT-based targets for self-reported education in Pennsylvania; L2 model of race weighted to match NYT-based targets derived from census data in Arizona)

• Marital status (L2 model)

• Homeownership (L2 model)

Advertisement

• Turnout history (NYT classifications based on L2 data)

• Method of voting in the 2020 elections (NYT classifications based on L2 data), in Montana and Arizona

• State region (NYT classifications)

• Census block group density (A.C.S. 5-Year Census Block Group data), in Montana

• History of voting in the 2020 presidential primary (L2 data), in Pennsylvania

Advertisement

• Census tract educational attainment, in Arizona

Finally, the sample of respondents who completed all questions in the survey was weighted identically as well as to the result for the general-election horse-race question (including voters leaning a certain way) on the full sample.

Weighting (likely electorate)

The survey was weighted by The Times using the R survey package in multiple steps.

First, the samples were adjusted for unequal probability of selection by stratum.

Advertisement

Second, the first-stage weight was adjusted to account for the probability that a registrant would vote in the 2024 election, based on a model of turnout in the 2020 election.

Third, the sample was weighted to match targets for the composition of the likely electorate. The targets for the composition of the likely electorate were derived by aggregating the individual-level turnout estimates described in the previous step for registrants on the L2 voter file. The categories used in weighting were the same as those previously mentioned for registered voters.

Fourth, the initial likely electorate weight was adjusted to incorporate self-reported intention to vote. Four-fifths of the final probability that a registrant would vote in the 2024 election was based on the registrant’s ex ante modeled turnout score, and one-fifth was based on self-reported intentions, based on prior Times/Siena polls, including a penalty to account for the tendency of survey respondents to turn out at higher rates than nonrespondents. The final likely electorate weight was equal to the modeled electorate rake weight, multiplied by the final turnout probability and divided by the ex ante modeled turnout probability.

Finally, the sample of respondents who completed all questions in the survey was weighted identically as well as to the result for the general election horse-race question (including leaners) on the full sample.

The margin of error accounts for the survey’s design effect, a measure of the loss of statistical power due to survey design and weighting.

Advertisement

The design effect for the full sample is 1.24 for the likely electorate in Montana, 1.29 for the likely electorate in Pennsylvania and 1.30 for the likely electorate in Arizona.

Among registered voters, the margin of sampling error is plus or minus 4.3 points in Montana, including a design effect of 1.26; plus or minus 3.8 points in Arizona, including a design effect of 1.20; and plus or minus 3.7 points in Pennsylvania, including a design effect of 1.23.

For the sample of completed interviews, among the likely electorate, the margin of sampling error is plus or minus 4.5 points in Montana, including a design effect of 1.29; plus or minus 4 points in Pennsylvania, including a design effect of 1.35; and plus or minus 4.1 points in Arizona, including a design effect of 1.30.

Historically, The Times/Siena Poll’s error at the 95th percentile has been plus or minus 5.1 percentage points in surveys taken over the final three weeks before an election. Real-world error includes sources of error beyond sampling error, such as nonresponse bias, coverage error, late shifts among undecided voters and error in estimating the composition of the electorate.

Advertisement
Continue Reading

Trending