Illinois
Paul Vallas: Illinois commission’s new recommendations on university funding don’t address racial inequities

The Illinois Commission on Equitable Public University Funding’s recommendation to allocate additional funding to universities based on race is not only misguided but also ignores the primary cause of inequities in higher education: the lack of school choice at the K-12 level.
This is not surprising, given that the commission was established under Public Act 102-0570 in 2021, with the premise that Illinois higher education is systemically racist and that more funding is the solution.
The commission’s primary goal was always to secure more funding, and it acknowledges that it is building upon the passage of the evidence-based formula in 2017, which changed how K-12 education in Illinois is funded. This formula pushed billions in new funds to local schools based on the notion that schools are underfunded, and that if they were adequately funded, academic success would follow.
The commission’s funding model, like the EBF model, includes a provision that base funding never drops at any university. This provision reduces the pressure to consolidate campuses. The bureaucrats sell this increased funding by wrapping it in equity arguments, asserting that universities cannot address equity issues because they are underfunded.
The State Higher Education Executive Officers Association in a 2022 report ranked Illinois No. 1 for state support for higher education. The report said the state allocated nearly $23,000 in funding per student to its universities for 2022. This is an increase of almost 55% from the 2012 level of $14,975. At No. 2 was Alaska at $18,436. The Illinois commission is asking taxpayers to provide another $1.4 billion in new funding to meet the goals stated in the report.
Page 25 of the commission’s report shows the numbers for one of the equity adjustments in the new funding formula, which incentivizes universities to admit minorities for greater funding. This formula values a Black student at $6,000, a Latino student at $4,000 and a rural student at $2,000.
The evidence presented for systemic racism is based on enrollment numbers and graduation rates by demographic. However, there is no attempt to examine the K-12 preparatory experience of students who graduated or failed to graduate. The commission is silent on the poor performance of public school children statewide.
School choice is welcomed at the higher education level for federal and state student financial aid — more than 54% of students enrolled in private colleges and universities have federal student loan debt. However, school choice is denied at the K-12 level. The Chicago Teachers Union advocates for getting rid of Chicago Public Schools’ charter and magnet schools as well.
National data speaks to the superior performance of minority students who attend charter or private schools. Stanford University’s Center for Research on Education Outcomes tracked public charter outcomes of millions of students, finding that charter schools produce superior student gains; these schools outperform peers in math and reading despite enrolling a more challenging student population.
Private schools have enjoyed extraordinary success. Catholic school students saw the nation’s highest scores on all four National Assessment of Educational Progress exams. When disaggregated by race, Catholic schools have shown significant gains since 2019, leading the nation for Latino achievement on each of the four tests and Black student achievement on three of the tests.
Chicago Archdiocese Catholic schools showed similar results, with students defying the national trend of pandemic-related stagnation and decline in academics. Illinois Policy Institute analysis of Illinois State Board of Education data shows that low-income students in Illinois who received scholarships from the Invest in Kids scholarship program were proficient in reading and math at a higher rate in nearly every grade compared to low-income, public school students in Illinois.
The success of school choice is a story of unique, individualized learning experiences, not one of family wealth or selection bias. The commission’s accusation of systemic racism in the higher education system while ignoring the role of the systematic efforts to deny quality K-12 school choices to poor families, overwhelmingly Black and Latino, is scholarly malpractice.
It’s clear that too few students, disproportionately Black and Latino, are getting the preparation they need to complete a university degree. It’s not the colleges’ fault; it’s the responsibility of our public elementary and secondary schools. The denial of quality education choices at the K-12 level undermines college preparedness.
Throwing more money at the most heavily subsidized university systems in the country and the best-funded K-12 public schools of almost any state in the nation, absent the commitment to improve the situation, will do little to improve equity.
Paul Vallas is an adviser for the Illinois Policy Institute. He has run for Chicago mayor twice and was previously budget director for the city and CEO of Chicago Public Schools.
Submit a letter, of no more than 400 words, to the editor here or email letters@chicagotribune.com.

Illinois
Counties with the highest unemployment in Illinois

Canva
#50. Williamson County
– April unemployment rate (preliminary): 4.3%
— 1-month change: Down 0.5 percentage points
— 1-year change: Up 0.4 percentage points
– Total labor force: 31,320 people (1,357 unemployed)

Henryk Sadura // Shutterstock
#49. Tazewell County
– April unemployment rate (preliminary): 4.3%
— 1-month change: Down 0.6 percentage points
— 1-year change: Up 0.3 percentage points
– Total labor force: 61,017 people (2,644 unemployed)

Canva
#48. Will County
– April unemployment rate (preliminary): 4.3%
— 1-month change: Down 0.7 percentage points
— 1-year change: Up 0.9 percentage points
– Total labor force: 373,554 people (16,060 unemployed)

Canva
#47. St. Clair County
– April unemployment rate (preliminary): 4.4%
— 1-month change: Down 0.4 percentage points
— 1-year change: Up 0.3 percentage points
– Total labor force: 124,884 people (5,535 unemployed)
Canva
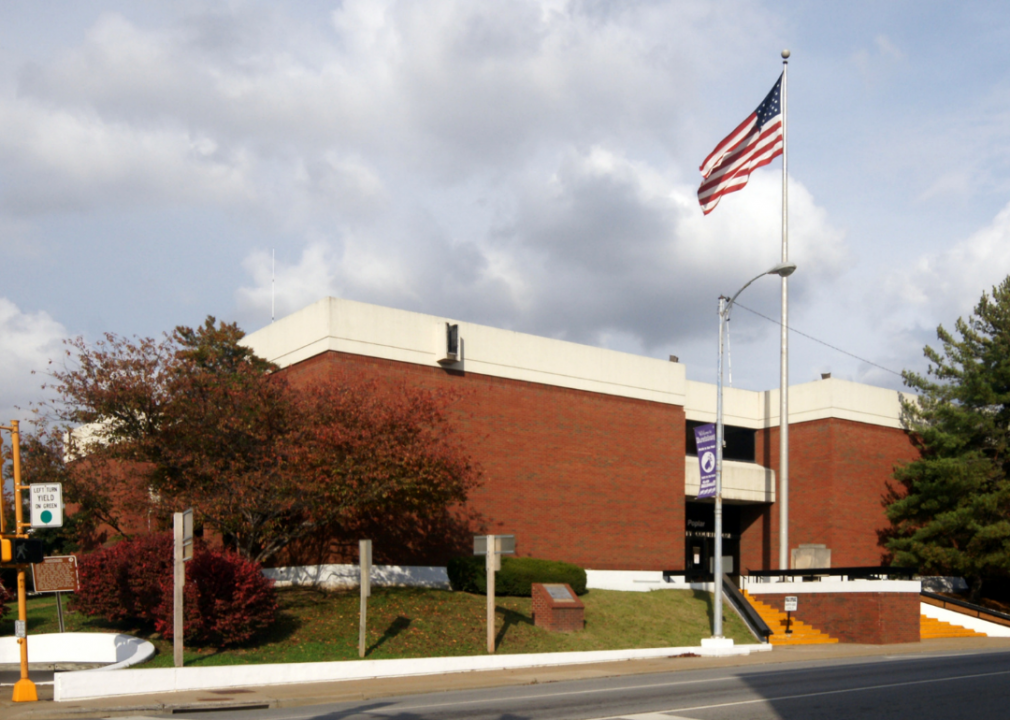
#46. Saline County
– April unemployment rate (preliminary): 4.5%
— 1-month change: Down 0.4 percentage points
— 1-year change: Up 0.2 percentage points
– Total labor force: 9,756 people (438 unemployed)

Canva
#45. Montgomery County
– April unemployment rate (preliminary): 4.5%
— 1-month change: Down 0.9 percentage points
— 1-year change: Down 0.3 percentage points
– Total labor force: 11,307 people (512 unemployed)
Canva
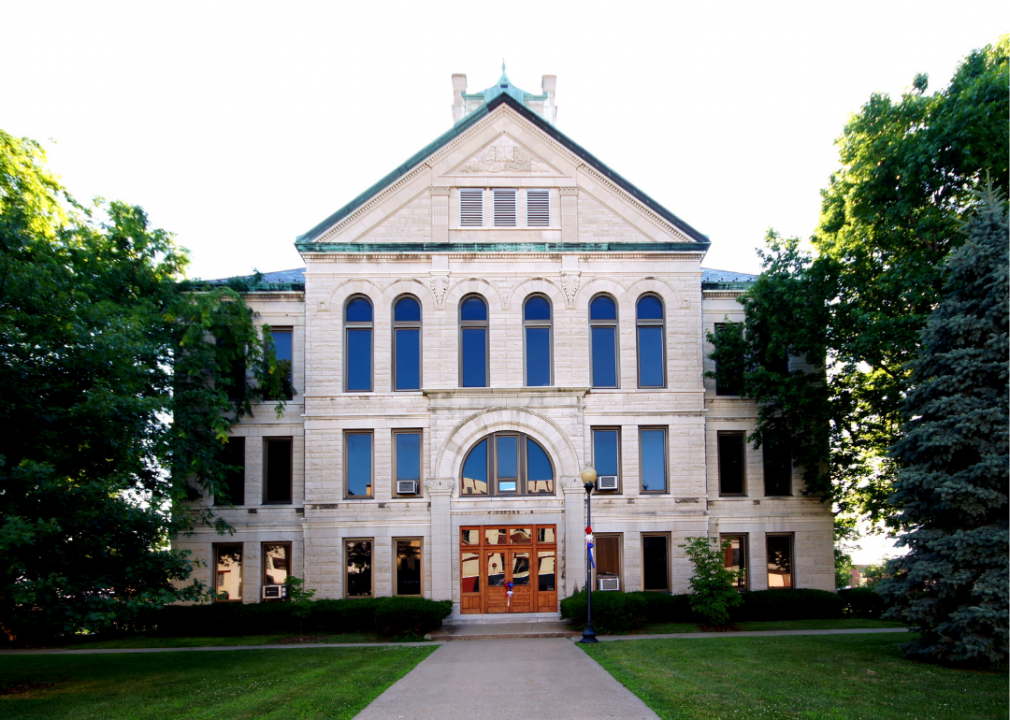
#44. Christian County
– April unemployment rate (preliminary): 4.5%
— 1-month change: Down 0.6 percentage points
— 1-year change: No change
– Total labor force: 13,290 people (603 unemployed)
Canva
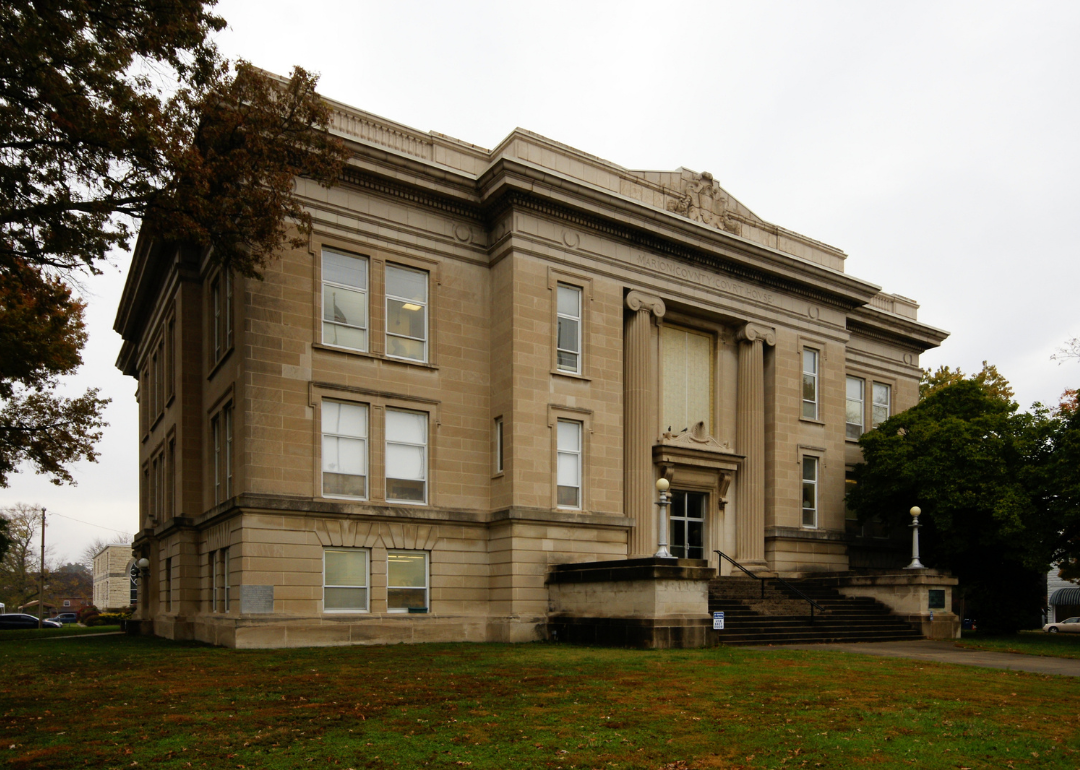
#43. Marion County
– April unemployment rate (preliminary): 4.5%
— 1-month change: Down 0.4 percentage points
— 1-year change: Up 0.4 percentage points
– Total labor force: 16,524 people (744 unemployed)

Canva
#42. Grundy County
– April unemployment rate (preliminary): 4.5%
— 1-month change: Down 0.9 percentage points
— 1-year change: Up 0.9 percentage points
– Total labor force: 26,611 people (1,191 unemployed)

Canva
#41. Whiteside County
– April unemployment rate (preliminary): 4.5%
— 1-month change: Down 0.8 percentage points
— 1-year change: Up 0.5 percentage points
– Total labor force: 27,301 people (1,236 unemployed)

Canva
#40. DeKalb County
– April unemployment rate (preliminary): 4.5%
— 1-month change: Down 0.6 percentage points
— 1-year change: Up 0.3 percentage points
– Total labor force: 53,982 people (2,455 unemployed)

Canva
#39. Cook County
– April unemployment rate (preliminary): 4.5%
— 1-month change: Down 0.4 percentage points
— 1-year change: Up 0.9 percentage points
– Total labor force: 2.7 million people (119,860 unemployed)

Roberto Galan // Shutterstock
#38. Massac County
– April unemployment rate (preliminary): 4.6%
— 1-month change: Down 0.2 percentage points
— 1-year change: Up 0.3 percentage points
– Total labor force: 5,342 people (247 unemployed)

Canva
#37. Mason County
– April unemployment rate (preliminary): 4.6%
— 1-month change: Down 0.6 percentage points
— 1-year change: No change
– Total labor force: 5,920 people (271 unemployed)

Eddie J. Rodriquez // Shutterstock
#36. Carroll County
– April unemployment rate (preliminary): 4.6%
— 1-month change: Down 1.1 percentage points
— 1-year change: Up 0.7 percentage points
– Total labor force: 7,075 people (324 unemployed)

Canva
#35. Fayette County
– April unemployment rate (preliminary): 4.6%
— 1-month change: Down 0.7 percentage points
— 1-year change: Down 0.1 percentage points
– Total labor force: 9,586 people (444 unemployed)

Canva
#34. Iroquois County
– April unemployment rate (preliminary): 4.6%
— 1-month change: Down 1.0 percentage points
— 1-year change: Up 0.4 percentage points
– Total labor force: 12,910 people (597 unemployed)

Canva
#33. Logan County
– April unemployment rate (preliminary): 4.7%
— 1-month change: Down 0.6 percentage points
— 1-year change: Up 0.5 percentage points
– Total labor force: 11,283 people (532 unemployed)

Eddie J. Rodriquez // Shutterstock
#32. Marshall County
– April unemployment rate (preliminary): 4.8%
— 1-month change: Down 0.8 percentage points
— 1-year change: Up 0.1 percentage points
– Total labor force: 5,061 people (242 unemployed)
SevenMaps // Shutterstock
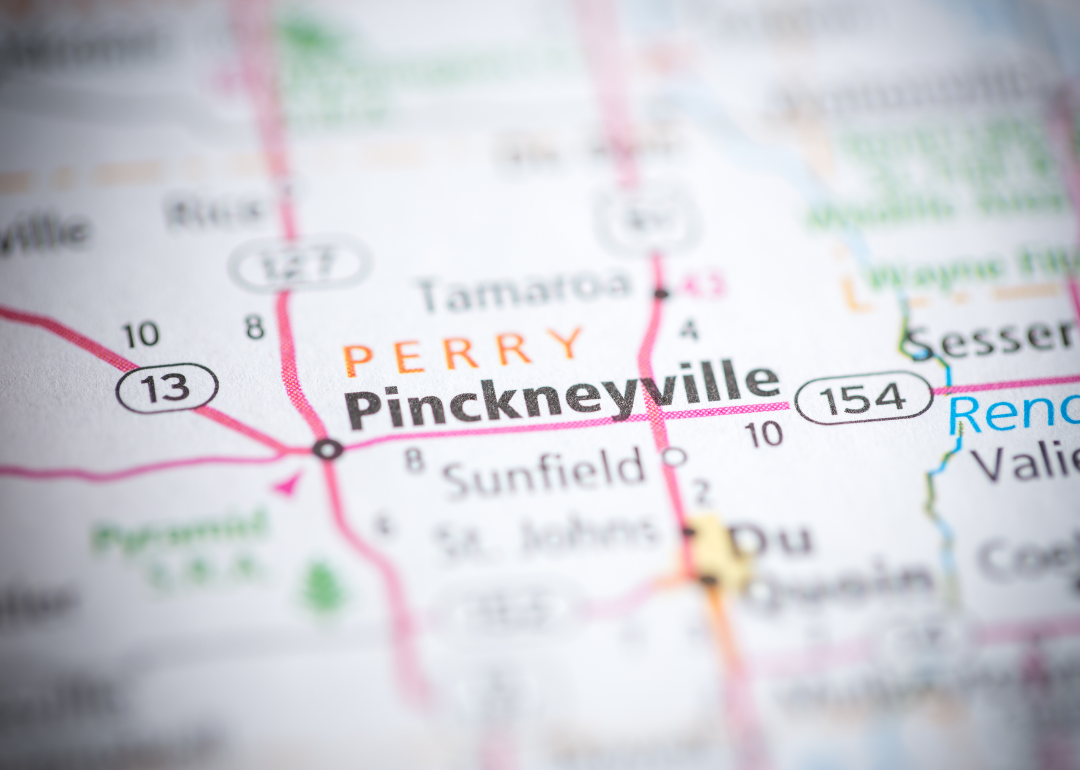
#31. Perry County
– April unemployment rate (preliminary): 4.8%
— 1-month change: Down 0.6 percentage points
— 1-year change: Up 0.2 percentage points
– Total labor force: 7,663 people (370 unemployed)

Canva
#30. Stephenson County
– April unemployment rate (preliminary): 4.8%
— 1-month change: Down 0.8 percentage points
— 1-year change: Up 0.2 percentage points
– Total labor force: 20,948 people (1,012 unemployed)

Gregory S. King // Shutterstock
#29. Scott County
– April unemployment rate (preliminary): 4.9%
— 1-month change: Down 0.9 percentage points
— 1-year change: Down 0.1 percentage points
– Total labor force: 2,267 people (112 unemployed)

Canva
#28. Fulton County
– April unemployment rate (preliminary): 4.9%
— 1-month change: Down 0.9 percentage points
— 1-year change: Down 0.1 percentage points
– Total labor force: 14,527 people (718 unemployed)
Canva
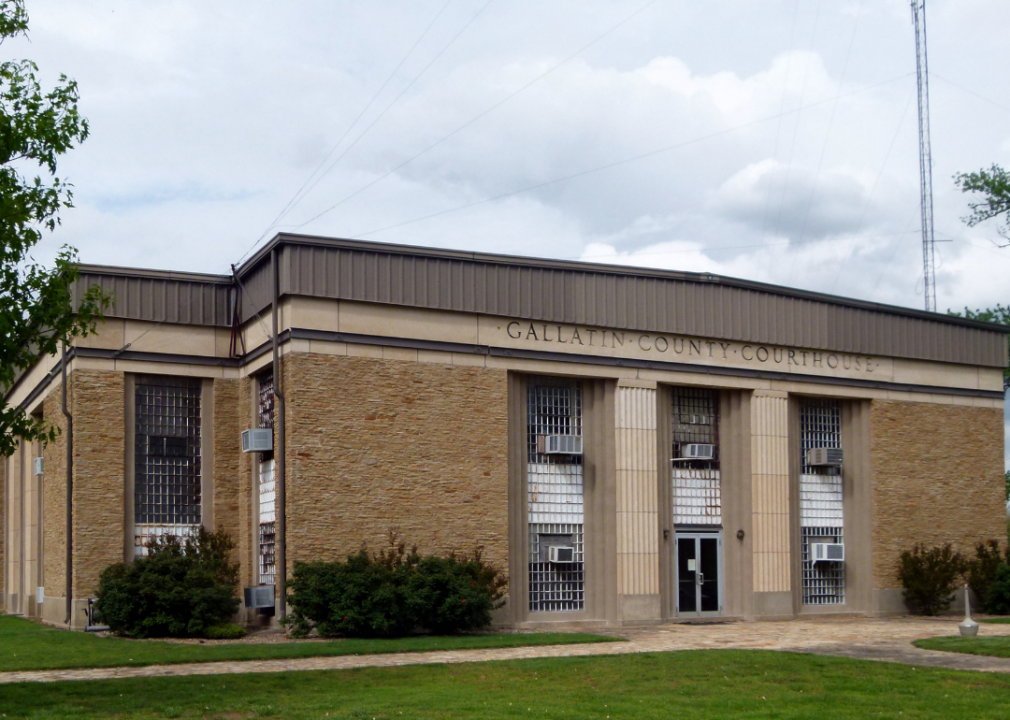
#27. Gallatin County
– April unemployment rate (preliminary): 5.0%
— 1-month change: Up 0.2 percentage points
— 1-year change: Up 0.6 percentage points
– Total labor force: 2,048 people (103 unemployed)

Canva
#26. Union County
– April unemployment rate (preliminary): 5.0%
— 1-month change: Down 0.8 percentage points
— 1-year change: Up 0.3 percentage points
– Total labor force: 7,110 people (354 unemployed)

Canva
#25. Clay County
– April unemployment rate (preliminary): 5.1%
— 1-month change: Down 0.5 percentage points
— 1-year change: Up 0.5 percentage points
– Total labor force: 5,756 people (294 unemployed)

Kent Raney // Shutterstock
#24. Rock Island County
– April unemployment rate (preliminary): 5.1%
— 1-month change: Down 0.5 percentage points
— 1-year change: Up 0.8 percentage points
– Total labor force: 65,829 people (3,388 unemployed)

Canva
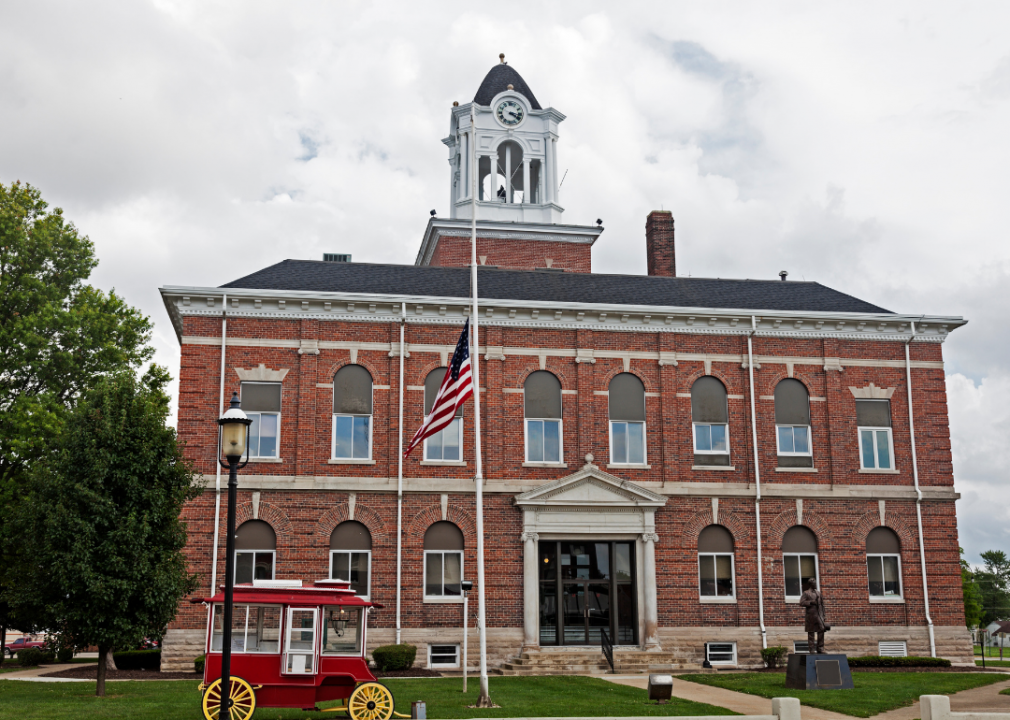
#23. Lake County
– April unemployment rate (preliminary): 5.1%
— 1-month change: Down 1.1 percentage points
— 1-year change: Up 0.4 percentage points
– Total labor force: 361,863 people (18,529 unemployed)
Canva
#22. Clark County
– April unemployment rate (preliminary): 5.2%
— 1-month change: Down 0.5 percentage points
— 1-year change: Up 1.3 percentage points
– Total labor force: 7,256 people (376 unemployed)

Canva
#21. Henry County
– April unemployment rate (preliminary): 5.2%
— 1-month change: Down 0.4 percentage points
— 1-year change: Up 0.7 percentage points
– Total labor force: 23,265 people (1,201 unemployed)

Canva
#20. Putnam County
– April unemployment rate (preliminary): 5.3%
— 1-month change: Down 1.5 percentage points
— 1-year change: Up 0.5 percentage points
– Total labor force: 2,952 people (157 unemployed)

marythebarberphotos // Shutterstock
#19. Franklin County
– April unemployment rate (preliminary): 5.3%
— 1-month change: Down 0.5 percentage points
— 1-year change: Up 0.6 percentage points
– Total labor force: 15,862 people (839 unemployed)

Roberto Galan // Shutterstock
#18. Vermilion County
– April unemployment rate (preliminary): 5.3%
— 1-month change: Down 0.4 percentage points
— 1-year change: Up 0.2 percentage points
– Total labor force: 31,702 people (1,678 unemployed)

Canva
#17. Kane County
– April unemployment rate (preliminary): 5.3%
— 1-month change: Down 1.0 percentage points
— 1-year change: Up 0.6 percentage points
– Total labor force: 266,000 people (14,041 unemployed)

Roberto Galan // Shutterstock
#16. Johnson County
– April unemployment rate (preliminary): 5.4%
— 1-month change: Down 0.6 percentage points
— 1-year change: Up 0.5 percentage points
– Total labor force: 4,223 people (229 unemployed)

Canva
#15. Lawrence County
– April unemployment rate (preliminary): 5.4%
— 1-month change: Down 0.6 percentage points
— 1-year change: Up 0.9 percentage points
– Total labor force: 4,947 people (265 unemployed)

Canva
#14. Ogle County
– April unemployment rate (preliminary): 5.4%
— 1-month change: Down 0.7 percentage points
— 1-year change: Up 0.1 percentage points
– Total labor force: 23,847 people (1,284 unemployed)

Canva
#13. Hardin County
– April unemployment rate (preliminary): 5.5%
— 1-month change: Up 0.1 percentage points
— 1-year change: Up 0.6 percentage points
– Total labor force: 1,436 people (79 unemployed)

Caileb Feik // Shutterstock
#12. Mercer County
– April unemployment rate (preliminary): 5.5%
— 1-month change: Down 0.5 percentage points
— 1-year change: Up 1.4 percentage points
– Total labor force: 7,478 people (413 unemployed)

Canva
#11. Stark County
– April unemployment rate (preliminary): 5.6%
— 1-month change: Down 0.8 percentage points
— 1-year change: Up 0.7 percentage points
– Total labor force: 2,384 people (133 unemployed)

Canva
#10. Knox County
– April unemployment rate (preliminary): 5.6%
— 1-month change: Down 0.4 percentage points
— 1-year change: Up 0.6 percentage points
– Total labor force: 20,151 people (1,130 unemployed)

Canva
#9. Peoria County
– April unemployment rate (preliminary): 5.6%
— 1-month change: Down 0.5 percentage points
— 1-year change: Up 0.5 percentage points
– Total labor force: 81,294 people (4,528 unemployed)

Canva
#8. Macon County
– April unemployment rate (preliminary): 5.7%
— 1-month change: Down 0.5 percentage points
— 1-year change: Up 0.1 percentage points
– Total labor force: 43,982 people (2,496 unemployed)

Canva
#7. Kankakee County
– April unemployment rate (preliminary): 5.7%
— 1-month change: Down 0.7 percentage points
— 1-year change: Up 0.3 percentage points
– Total labor force: 51,466 people (2,932 unemployed)

Canva
#6. LaSalle County
– April unemployment rate (preliminary): 5.8%
— 1-month change: Down 0.8 percentage points
— 1-year change: Up 0.6 percentage points
– Total labor force: 50,861 people (2,959 unemployed)

Canva
#5. Winnebago County
– April unemployment rate (preliminary): 5.8%
— 1-month change: Down 0.6 percentage points
— 1-year change: Down 0.3 percentage points
– Total labor force: 129,475 people (7,514 unemployed)

Canva
#4. Bureau County
– April unemployment rate (preliminary): 5.9%
— 1-month change: Down 1.0 percentage points
— 1-year change: Up 1.3 percentage points
– Total labor force: 15,506 people (922 unemployed)

Roberto Galan // Shutterstock
#3. Alexander County
– April unemployment rate (preliminary): 6.0%
— 1-month change: Down 0.1 percentage points
— 1-year change: Up 0.8 percentage points
– Total labor force: 1,815 people (108 unemployed)

JL Jahn // Shutterstock
#2. Boone County
– April unemployment rate (preliminary): 6.4%
— 1-month change: Down 1.5 percentage points
— 1-year change: Down 0.7 percentage points
– Total labor force: 24,413 people (1,569 unemployed)

Hank Shiffman // Shutterstock
#1. Pulaski County
– April unemployment rate (preliminary): 7.8%
— 1-month change: Up 0.9 percentage points
— 1-year change: Up 1.2 percentage points
– Total labor force: 1,631 people (127 unemployed)
This story features data reporting by Paxtyn Merten and is part of a series utilizing data automation across 50 states.
Illinois
Trump Guilty Verdict Local Reactions: Illinois Readers Weigh In

ILLINOIS — On Thursday, a jury in New York convicted former President Donald J. Trump on 34 felony counts in his criminal hush money trial.
It’s the first-ever criminal case against a former U.S. president, and even as Trump still faces charges in three other cases, his sentencing in the hush money case is scheduled for July 11 — just four days before he’s set to officially become the nominee for president at the Republican National Convention.
While Trump’s conviction means he could be sentenced to anything from home confinement to probation to up to four years in prison, he is still eligible to run for president in 2024, and, as multiple outlets have noted, the former president will almost certainly file an appeal.
Patch wants to know — how do voters in Illinois feel? Take our survey below to let us know.
The survey is not scientific, but will give a general gauge of how Illinois Patch readers feel going into the 2024 presidential election. We will share the results in a follow up story.
Illinois
Springfield, Illinois Chuck E. Cheese location to retain animatronic band

CHICAGO (CBS) — A Chuck E. Cheese in downstate Illinois will be one of the select few to retain an animatronic band.
In November, Chuck E. Cheese announced that it would be pulling the plug on the animatronic performances at all locations but one in the Northridge neighborhood of Los Angeles – where the company said Munch’s Make-Believe Band, as it’s known, would retain a “permanent residency.”
Chuck E. Cheese also said another location in Nanuet, New York, in Rockland County north of New York City, would retain the animatronic band—and remain a “100% retro store,” according to published reports.
But that was to be it.
In recent days, however, Chuck E. Cheese announced that three more locations would be keeping the robot band—including one at the Town & Country Shopping Center at 2369 S. MacArthur Blvd. in Springfield, the state capital. Also on the list to keep the band are Chuck E. Cheese in Hicksville, Long Island, New York, and Charlotte, North Carolina.
Earlier this month, Chuck E. Cheese President and Chief Executive Officer David McKillips told CBS News the company needed to keep up with the times and the interests of today’s kids. Thus, the animatronic band was on its way out, while trampoline zones, and floor-to-ceiling Jumbotrons overlooking digital dance floors, were on their way in.
“This is the most exciting time in the brand’s 47-year history,” McKillips told CBS News. “It’s a complete brand transformation here at Chuck E. Cheese.”
Active play areas are a major priority, McKillips said.
“Most importantly for mom, it’s bright, it’s clean, and now we’ve embraced active play installing trampolines in every single one of our locations coast to coast,” McKillips told CBS News.
He added that while Chuck E. Cheese has an “incredible legacy of bands,” it remains the reality that “like any other great brand, you have to evolve.”
Chuck E. Cheese has a grand total of 19 locations in Illinois, including two in Chicago—one in the Riverpoint Shopping Center at 1830 W. Fullerton Ave. along the Chicago River’s North Branch, the other at 5030 S. Kedzie Ave. in Gage Park. There are also 12 suburban locations, and five more either downstate or elsewhere in Northern Illinois. Chuck E. Cheese also has a location in Merrillville, Indiana.
Chuck E. Cheese and its animatronics date back over 40 years in Chicago, once had competition
Chuck E. Cheese was founded in 1977 by Atari’s co-founder, Nolan Bushnell, with the first location opening as Chuck E. Cheese’s Pizza Time Theatre in San Jose, California. It was the first family restaurant to marry food with arcade games and animated entertainment.
Chuck E. Cheese’s Pizza Time Theatre arrived in Illinois in 1981, with a location in Loves Park near Rockford. A Chicago location opened a couple of years later at the Harlem-Foster Shopping Center, at 7300 W. Foster Ave. on the city’s Northwest Side.
By contrast to today’s brightly-lit spaces, Chuck E. Cheese’s Pizza Time Theatre back in the 1980s was composed of so many massive, dimly-lit rooms with arcade games, mini-carnival rides, Skee-Ball and Whac-A-Mole, ball pits, and mazes with rope ladders to climb.
The Foster Avenue location featured three different rooms of animatronic musical acts. A main dining room featuring the Pizza Time Players—Jasper T. Jowls, Helen Henny, Pasqually, Mr. Munch, and of course Chuck E. Cheese himself—who back then was depicted as a wisecracking rat with a New Jersey accent and attire that to some suggested a casino pit boss, rather than today’s mouse in a skateboarder outfit. Other party rooms featured a band of dogs called “The Beagles,” and a lion in a white and gold jumpsuit called “The King”—which mimed along to real recordings of The Beatles and Elvis Presley, respectively. A fourth animatronic act, jazz-singing hippo Dolli Dimples, was the first sight seen upon entering the amusement venue.
An April 1983 Chicago Tribune article held up Chuck E. Cheese as one of a few operations capitalizing on a trend of offering pizza, video games, and other family-friendly entertainment under one roof.
“Combination pizza restaurant/video game parlors have invaded the Chicago area like locusts in the last few months,” writer Richard Phillips wrote in the article. “By summer’s end, their number may well be doubled.”
Chuck E. Cheese’s main competitor at the time was ShowBiz Pizza Place—which at the time had just opened a location in Park Ridge as its fifth in the Chicago suburbs. ShowBiz had its own animatronic band known as the Rock-afire Explosion, fronted by a bear character called Billy Bob Brockali.
The article also highlighted a third operation that was strictly local—ShowTime America, previously and subsequently known as Sally’s Stage, at 6335 N. Western Ave. across from the Nortown movie theater in West Rogers Park. Sally’s Stage did not have any animatronics—it was famous for its Barton theater pipe organ and hostesses on a roller skate track. But Phillips’ article did note that as of April 1983—while under the ShowTime America name—Sally’s did feature free video games for patrons and “Roger, a remote-control robot, who [when functional] impresses kids with questions and dispenses free tickets for sundaes.”
Of these, only Chuck E. Cheese remains—and not the one on Foster Avenue, which later became a Little Ceasar’s Caesarland and is now a Planet Fitness gym. ShowBiz and Chuck E. Cheese merged after Chuck E. Cheese’s Pizza Time Theatre filed for bankruptcy in 1984—and while they went on as separate concepts for a while, the Chuck E. Cheese name had prevailed for the whole operation by the early 90s. The site where Sally’s Stage once stood is now occupied by a Hanmi Bank.
As of August of last year, Chuck E. Cheese operated 568 corporate and franchised locations, as well as 122 Peter Piper Pizza restaurants.
-

 Politics1 week ago
Michael Cohen swore he had nothing derogatory on Trump, his ex-lawyer says – another lie – as testimony ends
-

 News1 week ago
Vince Fong wins special election to finish term of former House Speaker Kevin McCarthy
-

 News1 week ago
Video: Midwest Storms Destroy Homes
-

 World1 week ago
€440k frozen in Italy over suspect scam by fake farmers
-

 News1 week ago
Buy-now, pay-later returns and disputes are about to get federal oversight
-

 News1 week ago
Read the I.C.J. Ruling on Israel’s Rafah Offensive
-

 News1 week ago
Video: Protesters Take Over U.C.L.A. Building
-
 World1 week ago
Ombudsman probes Commission's senior staff 'revolving door'


