News
Results: The Most Detailed Maps of the Iowa Republican Caucuses

No vote estimates available.
Map is colored by the candidate who leads in each precinct. Lightly shaded areas are more sparsely populated.
Former president Donald J. Trump won the Iowa caucuses on Monday, with The Associated Press calling the race for Mr. Trump less than an hour after caucusing began. The state Republican party is reporting precinct-level results. This is the most detailed vote data available for the first 2024 presidential election contest.
The map above shows the leading candidate in each precinct. It is shaded according to the number of votes per square mile for that candidate, meaning sparsely populated areas where fewer caucusgoers live are lighter, and denser areas are darker.
How the top three candidates are doing in each precinct
Here’s another way to look at the results. In the maps below, precincts are shaded according to each candidate’s vote share for the three top candidates — Mr. Trump, Nikki Haley, the former South Carolina governor, and Gov. Ron DeSantis of Florida.
How Republicans are voting in different kinds of areas
This table shows the leading candidate in precincts that have reported votes, based on the demographics of those areas.
Lower income areas
Higher income areas Areas with fewer college graduates
Areas with more college graduates
Rural areas
Suburban areas
Urban areas
Precincts in…
Leader margin
Avg. vote share
—
—
—
—
—
—
—
—
—
—
—
—
—
—
Trump’s support
Mr. Trump improved significantly on his performance in the Iowa caucuses in 2016, when he received 24.3 percent of the vote, losing to Ted Cruz, who received 27.6 percent. Mr. Trump gained ground in many kinds of areas, but most of all in areas with lower average incomes and fewer college graduates.
Vote share for Trump in precincts …
Trump’s Iowa performance in 2016 compared with 2024
Each dot in the charts below represents one neighborhood’s caucus precinct. The dots are positioned on the charts based on the percentage of the vote each candidate received in that precinct.
Mr. Trump’s strength on Monday has cut across many different kinds of areas. His lead is most pronounced in areas with fewer college-educated voters.
Precincts in…
Lower income areas
Areas with fewer college graduates
Areas with more college graduates
DeSantis’s support
Mr. DeSantis is a distant second, trailing Mr. Trump by double digits. Mr. DeSantis, despite campaigning in all 99 Iowa counties, and earning the endorsement of key state officials and religious leaders, has not found consistent pockets of support among key demographic groups.
Precincts in …
Lower income areas
Areas with fewer college graduates
Areas with more college graduates
Haley’s support
Ms. Haley has performed her best in areas that are wealthier and have a higher concentration of college-educated voters. These include precincts that surround cities like Des Moines and Iowa City.
Methodology
Higher income areas are precincts where the median household income is $100,000 or more; lower income areas are where the median household income is less than $50,000. Areas with more college graduates are precincts where more than 40 percent of the population has a college education; areas with fewer college graduates are precincts where less than 15 percent of the population graduated college. The classification of areas as urban, rural or suburban is derived from research by Jed Kolko.
Chris Christie dropped out of the presidential race last week, but the Iowa Republican Party will still tabulate any votes he receives in the caucuses.
Election results are from The Associated Press. The Times publishes its own estimates for the number of remaining votes, based on historic turnout data and reporting from results providers. These are only estimates, and they may not be informed by reports from election officials. Precincts in …
Lower income areas
Areas with fewer college graduates
Areas with more college graduates


new video loaded: Iran to Allow More Oil Ships Through Strait of Hormuz, Trump Says
transcript
transcript
Iran to Allow More Oil Ships Through Strait of Hormuz, Trump Says
President Trump said that Iran had agreed to release 20 more cargo ships of oil through the Strait of Hormuz starting on Monday.
-
They gave us as a tribute, I don’t know, I can’t define it exactly, but they gave us, I think, out of a sign of respect, 20 boats of oil, big, big boats of oil, going through the Hormuz Strait. And that’s taking place starting tomorrow morning, over the next couple of days. A lot of boats.

By Jiawei Wang
March 30, 2026

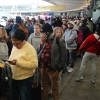
Travelers wait in long security checkpoint lines at George Bush Intercontinental Airport Friday, March 27, 2026, in Houston.
David J. Phillip/AP
hide caption
toggle caption
David J. Phillip/AP
Immigration and Customs Enforcement agents could remain at U.S. airports even after Transportation Security Administration workers receive their paychecks, according to White House border czar Tom Homan.
Asked if ICE agents will leave airports once TSA workers begin receiving pay again, Homan said on Sunday “we’ll see.”
“It depends on how many TSA agents come back to work [and] how many TSA agents have actually quit and have no plan [of] coming back to work,” Homan told CNN State of the Union host Jake Tapper.
Homan also said he spoke with Department of Homeland Security Secretary Markwayne Mullin, adding that there is a plan to get TSA workers paid “hopefully by tomorrow or Tuesday.”
“It’s good news… because these TSA officers are struggling. They can’t feed their families or pay their rent,” Homan told Tapper.
NPR reached out to DHS for additional comment on the timing of when workers would get paid but the department has not responded. A DHS social media post on Friday indicated TSA had begun the process of paying its workforce and that paychecks could arrive as early as Monday. That announcement came after President Trump signed a memo ordering that workers get paid from existing funds, even though Congress has not allocated the money amid an impasse over passing legislation to fund DHS. It remains unclear where the money would come from to fund the paychecks as NPR previously reported.
It’s been a week since the president ordered ICE to send agents to airports around the country to help TSA with security as the DHS shutdown entered a sixth week.
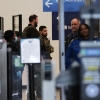
ICE officers have been assisting TSA agents by “checking identification” and “plugging other security holes,” allowing remaining TSA workers to focus on tasks that require more training, such as monitoring machines that examine luggage, according to Homan.
About 50,000 transportation security workers have been forced to continue working without pay, missing multiple paychecks since disagreements in Congress led to a DHS shutdown. More than 480 TSA workers have quit, according to TSA Acting Administrator Ha Nguyen McNeill. She told lawmakers at a hearing last Wednesday that worker absences were as high as 40% at some airports. That has led to long wait times for passengers at security checkpoints.
Homan says those lines have already become shorter.
“I was in Houston — wait lines decreased in about half. We got additional agents going to Baltimore yesterday, to bring those lines down,” Homan told CNN.
A notice on Baltimore/Washington International Thurgood Marshall Airport’s web page Sunday afternoon said wait times had improved since Saturday but remained longer than normal. At George Bush Intercontinental Airport in Houston, security wait times were under two hours Sunday. But the airport warned travelers that “TSA lines could exceed four hours.”
As for when permanent funding for DHS can be reached, that remains unclear. Negotiations in Congress remain stalled as lawmakers left Washington for a planned recess. The Senate returns April 13. The House is back on April 14.

More than 8 million people showed up across 3,300 No Kings protests on Saturday, calling for an end to the war in Iran, immigration agents in their communities and what they see as Trump’s creeping authoritarianism. Organizers say it’s the greatest number of protests in a single day in US history.
But movement scholars say social change doesn’t begin and end with one protest. It takes activism at the local and national level, and in a variety of forms, to bring about change.
“No Kings was conceived to unite a cross-movement push against authoritarianism. And there is not one way to fight it,” said Leah Greenberg, a co-executive director of the Indivisible Project, which founded the No Kings movement. “We see No Kings as part of a tapestry of defiance that is going on.”
In the past year, Americans have demanded change through a variety of actions. When Donald Trump sent federal agents into Los Angeles and Chicago, people rallied in the streets and called for “ICE Out!” When consumers wanted to express disapproval of corporations’ ties to Trump, they initiated boycotts of Target, Tesla and Amazon. When students were upset at the presence of ICE agents in their schools and communities, they organized walkouts.
“Protests build power by garnering attention and pulling people off the sidelines into action,” said Hahrie Han, a political scientist at Johns Hopkins University and the author of Prisms of the People: Power and Organizing in Twenty-First-Century America. “And if we look historically and across different movements, change is often a combination of people taking action through a variety of means and then leaders negotiating for power given the actions that people have taken.”
Han pointed to activists in Minnesota who were able to pass a raft of progressive and pro-labor laws in 2023 – paid family and medical leave and driver’s licenses for undocumented residents, among others – as an example of successful movement building by organizing with multiracial coalitions, strategizing with legislators and negotiating proposed legislation.
“It’s one of the most generous social safety nets in the country, and organizers were able to put grassroots energy together with institutional politics,” said Han.
No Kings’ success, organizers say, will be defined by whether attendees have signed up to organize in their communities and follow through on other actions, like know-your-rights trainings and mutual aid.
“What we think is actually important are the ways in which these large-scale gatherings fuel ongoing organizing that might look like economic non-cooperation, local mutual aid organizing or legislative advocacy at the state or local level,” said Greenberg. “It’s all connected if we do it right.”
Here’s a look at how these efforts have worked over time.
Protest
Some of the earliest protests in America include covert and overt acts that enslaved people took to object to bondage, including working slowly in the fields, breaking or misplacing tools, setting fires or running away. Enslaved people also attempted to free themselves by organizing armed rebellions and revolts.
Occupation has historically been another effective form of protest. Throughout the 1900s, Indigenous Americans protested US treaty violations by occupying Alcatraz Island, Mount Rushmore and the bureau of Indian affairs building to demand land back.
But probably the most recognizable form of protest is the one in the streets, immortalized in the marches, freedom rides and sit-ins of the civil rights movement for social justice and equal rights in the 1950s and 1960s.
Over the past 10 years, numerous mass protests have swept through the country, including March for Our Lives in 2018 to demand stricter gun control measures, the Black Lives Matter protests, triggered by the police killing of George Floyd in 2020, and the No Kings protests against the Trump administration last October. In 2025, the first year of Trump’s second term, more people protested in the streets than in 2017, the first year of his first term, according to data from the open-source project Crowd Counting Consortium
“The amount of people protesting is record-breaking,” said Hunter Dunn, an organizer with the grassroots organization 50501, which co-founded No Kings. “There’s also enthusiasm for using protests as a launchpad to get people involved in local organizing – whether it’s election defense with the midterms coming up, or immigrants’ rights organizing or organizing against AI data centers.”
Rally, march and parade
During rallies, people often gather at parks, on streets and other public locations to bring attention to a cause. A street protest or march can also culminate in a rally, where participants take turns speaking, performing music or leafleting attendees to share goals and literature about the cause.
Much like “rally”, “march” and “parade” are also terms used interchangeably with “protest”. In 1913, suffragists held the Women’s Suffrage Parade to draw attention to how women could vote in only nine states.
In 2017, activists held the first Women’s March the day after Trump’s first inauguration, protesting his rhetoric and platform as misogynistic and an overall threat to women. Activists and scholars have credited the march with driving the #MeToo movement and a record number of women to participate in the 2018 midterm elections.
“There was something special and different when people said #MeToo,” Fatima Goss Graves, president and CEO of the National Women’s Law Center, told the Guardian. “We had worked on issues related to harassment and gender-based violence over many decades. But the #MeToo movement really gave people a framework to speak out and name their experiences.”
General strike
Labor unions have a rich history of protest in the US, particularly in the form of a strike or a work stoppage in which workers demand better conditions, including healthcare benefits, on-the-job safety protections and higher wages.
A general strike is much larger; it’s when a sizable portion of the workforce in a certain town or region stops working to bring about economic or social change.
The first general strike in North America was in 1835 in Philadelphia, where 20,000 workers across 40 sectors demanded a 10-hour workday and fairer wages. In the end, they won – incorporating rallies, parades and newspaper campaigns to secure 10-hour workdays for skilled and unskilled workers in the city – and became the catalyst of labor organizing in the US.
After federal immigration agents killed Minneapolis residents Renee Good and Alex Pretti this January, organizers called for a national general strike of “no school, no work, and no shopping” to protest the presence and brutality of federal agents in the city. Thousands in Minnesota participated in protests, hundreds of businesses closed and work stoppages occurred across a variety of sectors, backed by labor unions.
“Those of us in the trade union movement understand the leverage and power that our labor has, and we are going to try and use that, because really there’s nothing else left,” Kieran Knutson, the president of Communications Workers of America (CWA) Local 7250 in Minneapolis, told the Guardian in January.
Boycott and divestment
Boycotts of corporations have historically involved a refusal to purchase their products or engage with their services, with the hope that punitive pressure can change attitudes and behaviors. Alternatively, a “procott” involves shifting resources to entities that people want to support – such as small local businesses – as they suspend support for others.
In the 1930s, Black Americans led “Don’t Buy Where You Can’t Work” campaigns in northern cities to advocate for Black jobs at white-owned businesses in Black neighborhoods. The boycotts and picketing, in which protesters stood outside of businesses and held signs, created jobs for Black workers during the Depression.
Divestments are a related form of protest. In 1985, UC Berkeley students demanded the university divest from South Africa in protest against apartheid. Students led rallies, teach-ins and encampments to pressure the university. A year later, the University of California board of regents voted to divest $3bn from companies with ties to South Africa.
In 2025, Americans’ boycott of Target – after the company rolled back its Diversity, Equity, and Inclusion (DEI) efforts – had an impact: Target acknowledged the boycott was one of the reasons sales were down last year.
“We are reclaiming our power,” LaTosha Brown, co-founder of Black Voters Matter, told the Guardian during a Black Friday boycott the group helped spearhead last year. “We are redirecting our spending. And we are resisting this rise to authoritarianism.”
Mutual aid
Under an ethos of “solidarity,” mutual aid involves a network of volunteers gathering resources – food, housing assistance and childcare – to support the needs of people in their communities.
In response to the HIV/Aids crisis of the 1980s, LGBTQ+ groups across the country developed care networks to support vulnerable community members. During the coronavirus pandemic, local organizations across the country stepped up to help low-income families, frontline workers and immunocompromised people through grocery delivery programs. One such aid program in Brooklyn, New York, supported 28,000 people with groceries between March 2020 and June 2021.
During Operation Metro Surge in Minneapolis in January, in which 3,000 ICE agents killed two Minneapolis residents and arrested hundreds, mutual aid networks were vital for distributing food, money and diapers to immigrant families sheltering in place out of fear of being stopped by ICE.
Brittany Kubricky, a Minneapolis resident, told the Guardian earlier this year she was organizing donations, grocery deliveries and school pick-ups from her dining room table. “I haven’t really ever done something like this before,” she said. “This is just something I tried, and it happens to be working.”
Walkout
When students and employees walk out of schools or workplaces to express their disapproval over a certain issue, the idea is to do so in numbers – the more people who participate, the more impactful the message.
In 1968, 15,000 students walked out en masse as part of the East Los Angeles Walkouts to protest disparities in educational outcomes between white American and Mexican American students. After the walkout, students submitted demands to the Los Angeles board of education to improve the bilingual education curriculum, among other issues. Even though police arrested organizers and the board rejected their demands, the walkout was one of the largest student protests in history.
Walkouts remain a viable protest tactic for young people today, including to voice their grievances against ICE. “This was our way to make our voices heard,” Lark Jeffers told the Guardian after participating in the Free America walkout on 20 January in Silver Spring, Maryland. “Because at the end of the day, we’re 16 – what we say isn’t going to make the lawmaker listen to us.
Teach-in
This longtime form of protest is about sharing knowledge. Activists and protest leaders spend time lecturing people in the movement about their causes, often opening debate and discussion as a means of raising awareness and spurring further action.
Teach-ins were popularized during the Vietnam war when students used them to discuss the war draft and strategies to curtail the US government’s involvement abroad. The first teach-in, which included lectures, debates and films, took place at the University of Michigan in 1965 and was attended by 3,500 students and supporting faculty members. The teach-in boosted the national anti-war movement and inspired other campuses to protest and hold teach-ins of their own.
Teach-ins once again became popular on US college campuses in 2024 as Israel bombed the Gaza Strip following Hamas’ attack. The teach-ins, often in student encampments, educated participants about the long fight for Palestinian freedom and the Boycott, Divestment, Sanctions (BDS) movement that seeks to isolate Israel economically, politically and culturally over its oppression of Palestinians.
Composites: Rita Liu/The Guardian/Getty Images/Wikimedia Commons

A New Homelessness Strategy is Sweeping California – edhat

Colorado’s Biggest Priorities After Losing Bangot Dak

Food workers at CT service plazas secure landmark union contract

Man’s body discovered off Route 40 in New Castle, Delaware

Florida man ‘purposely walked’ onto tracks before being hit by train

Florida High School Football Rankings: Top 25 teams – Oct. 21

How old is Bo Nix? What to know about Oregon quarterback ahead of 2024 NFL Draft

Cleary's 21 help Le Moyne down Central Connecticut State 69-64 in OT

99th annual Pony Swim held in Virginia

Indiana Members Credit Union announced as new anchor tenant at Bottleworks District

Video: Iran to Allow More Oil Ships Through Strait of Hormuz, Trump Says

Dem senator warns deportation could let Virginia woman’s illegal immigrant killer ‘escape accountability’

Newsletter: G7 ministers to hold talks on war’s economic fallout
ICE officers could remain at airports after TSA workers are paid

Scathing report claims nation’s oldest labor union ‘betrayed’ MAGA members through ‘shocking’ spending
-

 Sports1 week ago
IOC addresses execution of 19-year-old Iranian wrestler Saleh Mohammadi
-

 Miami, FL4 days ago
Jannik Sinner’s Girlfriend Laila Hasanovic Stuns in Ab-Revealing Post Amid Miami Open
-

 New Mexico1 week ago
Clovis shooting leaves one dead, four injured
-

 Politics1 week ago
Schumer gambit fails as DHS shutdown hits 36 days and airport lines grow
-

 Tennessee7 days ago
Tennessee Police Investigating Alleged Assault Involving ‘Reacher’ Star Alan Ritchson
-

 Minneapolis, MN4 days ago
Boy who shielded classmate during school shooting receives Medal of Honor
-

 Science1 week ago
Record Heat Meets a Major Snow Drought Across the West
-

 Politics1 week ago
Trump gives Iran 48-hour ultimatum to reopen Strait of Hormuz or face strikes on power plants