Politics
Wisconsin consultants label GOP's redistricting map proposals as gerrymanders
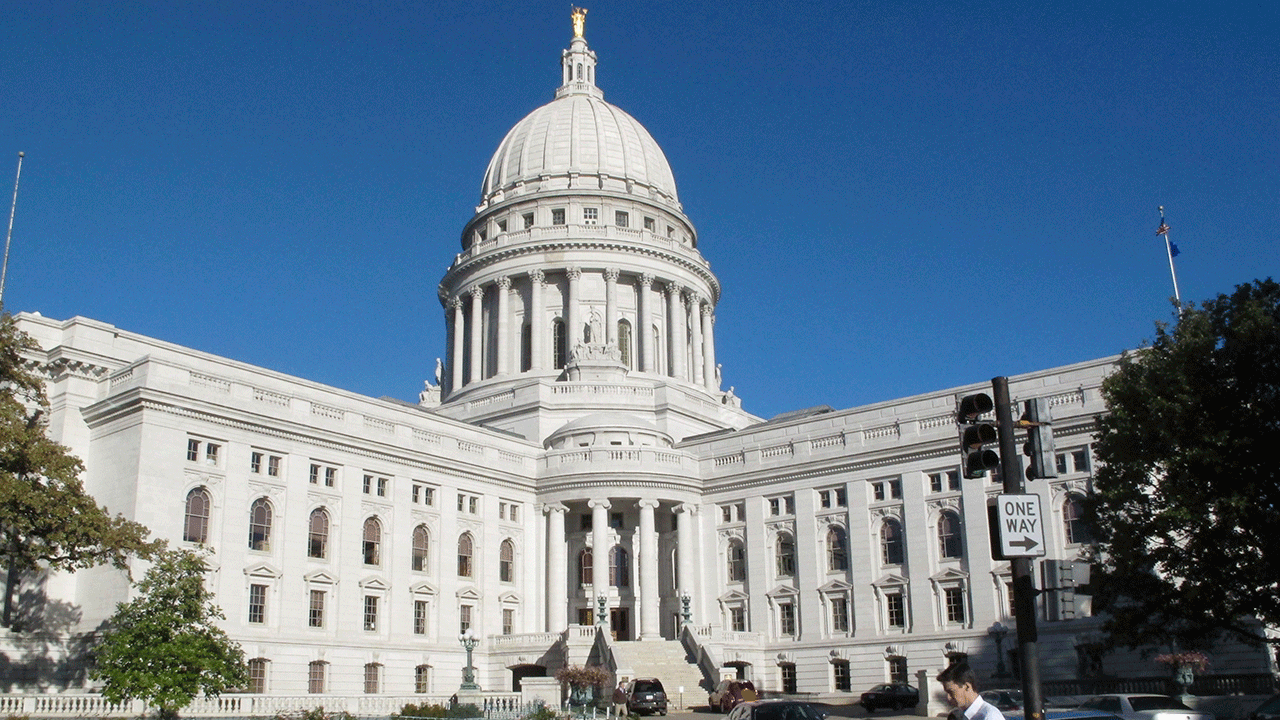
- Consultants hired by the Wisconsin Supreme Court identified the Republican Legislature and a conservative law firm’s maps as partisan gerrymanders.
- The consultants noted key criteria for map improvement, including political neutrality, compactness, contiguity and preserving communities of interest.
- The battleground state of Wisconsin, where Republicans control the Legislature despite Democratic wins in statewide elections, faces significant political implications.
Consultants hired by the Wisconsin Supreme Court to examine maps redrawing state legislative districts said Thursday that plans submitted by the Republican Legislature and a conservative law firm are partisan gerrymanders, but they stopped short of declaring the other four maps constitutional.
Only the court can make the determination of whether any of those four plans from Democratic Gov. Tony Evers, Democratic lawmakers and others are constitutional, wrote Jonathan Cervas, of Carnegie Mellon University in Pittsburgh, and Bernard Grofman, of the University of California, Irvine.
Any of those maps could be improved based on criteria the court identified as being important, including political neutrality, compactness, contiguity and preserving communities of interest, the consultants wrote.
WISCONSIN REPUBLICANS WOULD MAINTAIN MAJORITY IN PROPOSED LEGISLATIVE MAPS, BUT WITH REDUCED DOMINANCE
They declined to draw their own maps, but said they could do so quickly if the court instructed them to.
The Wisconsin state Capitol is seen on Oct. 10, 2012, in Madison, Wisconsin. Consultants hired by the Wisconsin Supreme Court to examine maps redrawing state legislative districts said on Thursday that plans submitted by the Republican Legislature and a conservative law firm are partisan gerrymanders. (AP Photo/Scott Bauer, File)
The political stakes are huge in the battleground state where Republicans have had a firm grip on the Legislature since 2011 even as Democrats have won statewide elections, including for governor in 2018 and 2022. Four of the past six presidential victors in Wisconsin have been decided by less than a percentage point.
Evers hailed the report as confirmation that the Republican maps are gerrymandered.
“The days of Wisconsinites living under some of the most gerrymandered maps in the country are numbered,” Evers said in a statement. “While this is just one step in this process, today is an important day for the people of Wisconsin who deserve maps that are fair, responsive, and reflect the will of the people.”
Under maps first enacted by Republicans in 2011, and then again in 2022 with few changes, the GOP has increased its hold on the Legislature, largely blocking major policy initiatives of Evers and Democratic lawmakers for the past five years.
The victory last year by a liberal candidate for Wisconsin Supreme Court, who called the current Republican maps “rigged,” cleared the path for the court’s ruling in December that the maps are unconstitutional because districts are not contiguous as required by law.
The court ordered new maps with contiguous districts, but also said they must not favor one party over another. Republicans have indicated that they plan an appeal to the U.S. Supreme Court, arguing due process violations, but it’s not clear when that would come.
The consultants reviewed proposed maps submitted by Evers, fellow Democrats, Republicans, academics and others that would reduce the Republican majorities that sit at 64-35 in the Assembly and 22-10 in the Senate.
The consultants on Thursday called the maps from the Legislature and the conservative Wisconsin Institute for Law and Liberty “partisan gerrymanders.” The Legislature’s map was virtually unchanged from what the current boundaries are.
The consultants rejected Republican claims that their majorities in the Legislature are due to Democratic support being concentrated in cities, while the GOP had broader support in a larger geographic area.
“That kind of insulation from the forces of electoral change is the hallmark of a gerrymander,” they wrote. “To put it simply, geography is not destiny.”
Cervas and Grofman wrote that the four Democratic maps were similar on most criteria and from a “social science point of view,” are “nearly indistinguishable.”
Rick Esenberg, president of the law firm whose map was deemed to be a partisan gerrymander, blasted the consultants’ findings.
“The report hides its bias behind a fog of faux sophistication,” Esenberg said in a statement. “Let’s be clear, our maps have been rejected for one reason and one reason alone, they don’t produce the partisan outcomes the experts or many on the Court want.”
It ultimately will be up to the Wisconsin Supreme Court, with a 4-3 liberal majority, to decide which maps to enact. The state elections commission has said that must be done by March 15 to meet deadlines for candidates running in the fall.
Evers on Tuesday vetoed a last-ditch effort by Republicans to enact new lines to avoid the court ordering maps. Republicans largely adopted the Evers maps but moved some lines to reduce the number of GOP incumbents who would have to face one another in the new districts.
WISCONSIN REPUBLICANS HASTILY APPROVE NEW LEGISLATIVE MAPS
Evers rejected it, calling it another attempt by Republicans to gerrymander the districts in their favor.
Under most of the newly proposed maps, Republicans would retain their majorities in the Legislature, but the margin would be significantly tightened, judging by an analysis by a Marquette University researcher.
The Wisconsin Supreme Court has also been asked by Democrats to take up a challenge to the state’s congressional district lines. That lawsuit argues the court’s decision to order new state legislative maps opens the door to challenging the congressional map. Republicans hold five of the state’s eight congressional seats.
The moves in Wisconsin come as litigation continues in more than dozen states over U.S. House and state legislative districts that were enacted after the 2020 census.

Politics
Park Police union says officers ‘did everything they could’ during DC anti-Israel riot
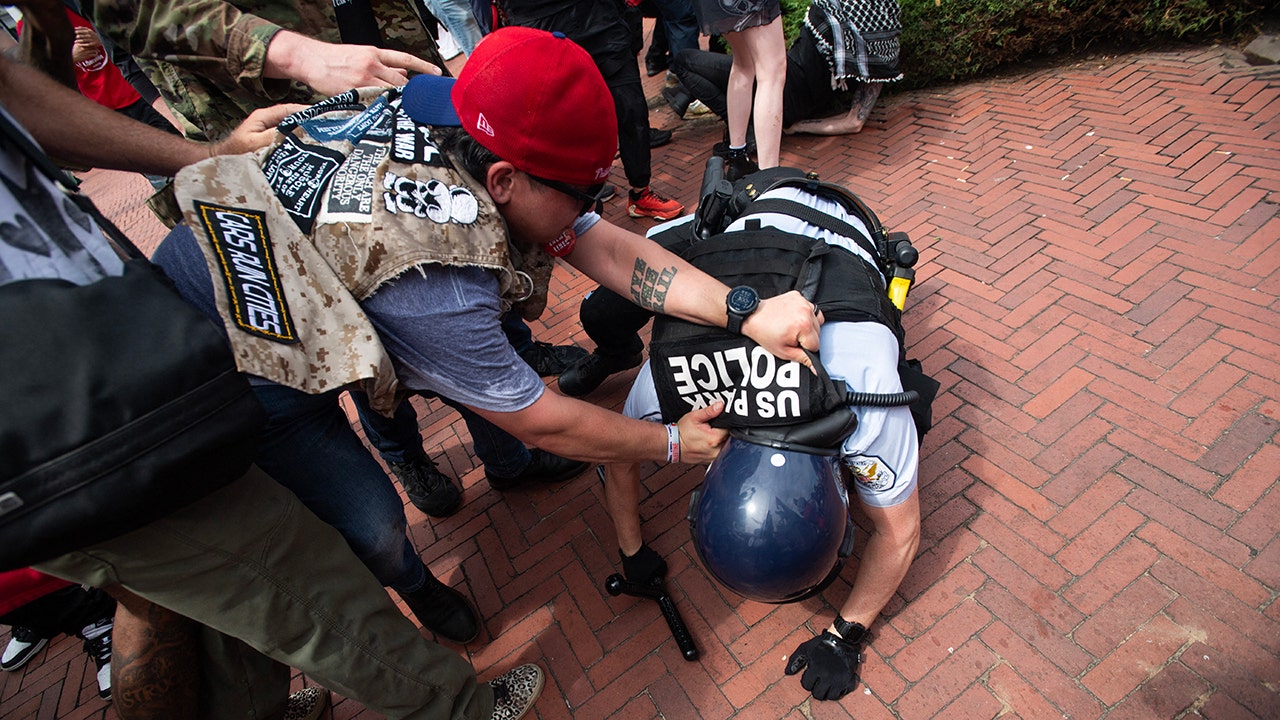
Following the protests at Union Station by anti-Israel agitators defacing federal property in protest of Israeli Prime Minister Benjamin Netanyahu’s address to Congress, a Park Police union is pushing back against criticism that only a few arrests were made.
Thousands of Hamas-sympathizing agitators descended on Washington, D.C., Tuesday, at one point defacing federal monuments with phrases in support of the terrorist group responsible for the Oct. 7 attacks in Israel, saying, “Hamas is coming.”
Twenty-three people were arrested at the protests, but some have suggested that number should have been higher.
Sen. Marco Rubio, R-Fla., posted on X, “How many more times are they going to allow leftist degenerates who support terrorism and hate America to vandalize property and attack police? There should have been hundreds of arrests today in D.C. not just 23.”
HOUSE REPUBLICANS REPLACE AMERICAN FLAGS AT UNION STATION AFTER ANTI-ISRAEL PROTESTS
The Columbus Memorial Fountain at Union Station during an anti-Israel protest on the day Israeli Prime Minister Benjamin Netanyahu addressed a joint meeting of Congress on Capitol Hill in Washington July 24, 2024. (Reuters/Seth Herald)
But the U.S. Park Police Labor Committee is pushing back.
“Our officers on the ground did everything they could to protect life and property. In fact, despite having only 29 officers available to mitigate damage — 29! — with no additional help from the Department of the Interior, we processed several arrests for charges ranging from assault on a police officer to destruction of government property,” Kenneth Spencer, chairman of the United States Park Police Fraternal Order of Police, said in a statement.
“That’s why it’s so disheartening to hear some members of Congress and members of the media, many of whom describe themselves as ‘champions’ of law enforcement, suggesting that officers gave protesters a ‘pass’ or that insufficient arrests were made.
“Nothing could be further from the truth. Anyone who truly cares to understand the problem would see that our officer staffing crisis is at the root of our agency’s mission readiness. A small unit of 29 officers arrested 10 individuals while being assaulted by a mob of thousands. We simply did not have the staffing or resources to accomplish a mass arrest operation.”
SEE IT: THE MOST DRAMATIC PHOTOS FROM WEDNESDAY’S PRO-HAMAS WASHINGTON, D.C. PROTESTS

An anti-Israel demonstrator sprays graffiti on the Christopher Columbus Memorial Fountain at Union Station on the day of Israeli Prime Minister Benjamin Netanyahu’s address to a joint meeting of Congress on Capitol Hill in Washington July 24, 2024. (Reuters/Nathan Howard)
At least one demonstrator, whose face was covered, was spotted by Fox News carrying what appeared to be the flag of the terrorist group Hamas while others were heard shouting “Allahu Akbar.”
KAMALA HARRIS REACTS TO ANTI-ISRAEL RIOTS AT DC’S UNION STATION

Anti-Israel demonstrators burn an effigy depicting Israeli Prime Minister Benjamin Netanyahu outside Union Station on the day of Netanyahu’s address to a joint meeting of Congress on Capitol Hill in Washington July 24, 2024. (Reuters/Nathan Howard)
The White House condemned the protests Wednesday evening, calling the chaos “disgraceful.”
“Identifying with evil terrorist organizations like Hamas, burning the American flag or forcibly removing the American flag and replacing it with another is disgraceful,” White House spokesperson Andrew Bates said in a comment to Fox News Digital Wednesday evening.
Politics
Ali: Kamala Harris has a campaign soundtrack: Beyoncé's 'Freedom'

Vice President Kamala Harris’ bid for the presidency has a soundtrack: Beyoncé’s “Freedom.”
The leading Democratic presidential candidate took the stage in her first visit to her Wilmington, Del. campaign headquarters and again during her first campaign rally in Wisconsin as the song played.
Now the cathartic anthem graces Harris’ first campaign ad, in which she says: “There are some people who think that we should be a country of chaos, of fear, of hate. But us? We choose something different: We choose freedom.”
Pit that against the musical number her competitor chose for his grand entrance on Night 3 of the Republican National Conference. Donald Trump walked out to James Brown’s “It’s a Man’s, Man’s, Man’s World,” a tone-deaf choice for a former president found liable for sexual abuse, who’s bragged about sexually assaulting women, a married man who paid hush money to a porn star and a former president who rolled back women’s reproductive rights 50 years with the repeal of Roe vs. Wade.
Maybe the Godfather of Soul would have endorsed Trump’s usage of his song, but Brown would be breaking with decades’ worth of musicians who’ve decried GOP candidates playing their tracks at rallies and booster events. Adele, Rihanna, R.E.M., the Rolling Stones, Prince, Neil Young, Guns N’ Roses and Queen are among the many artists who’ve spoken out against Trump using their tunes for campaign purposes.
Heart bristled when the McCain-Palin campaign used “Barracuda.” Tom Petty insisted George W. Bush back away from “I Won’t Back Down.” Bruce Springsteen decried Ronald Reagan’s appropriation of “Born in the U.S.A.”
Beyoncé, however, gave Harris her blessing to use “Freedom,” a single from her 2016 blockbuster album “Lemonade.” The song, which features guest rapper Kendrick Lamar, is an explosive expression of empowerment. At the time of its release, it spoke to public outcry around police killings of unarmed Black men and women — Eric Garner, Tamar Rice, Freddie Gray — and protests that were largely fueled by the ire of younger generations.
Whether Beyoncé was singing about the tyranny of a cheating spouse or racial injustice (or both), the song became an anthem for a new, potentially potent block of the American electorate.
For the first time, Gen Z and millennials could now account for as many votes as baby boomers and their elders, groups that have made up a majority of the electorate for decades.
Folks under 40 have grown up with Beyoncé and her ubiquitous work. Think of Beyoncé like the Who for boomers — their work is everywhere (Republican Sen. Rand Paul played the band’s anti-war hit “Baba O’Riley” when he campaigned in 2015) — or Nirvana for Gen X, except no one cares what we think. Whatever, nevermind.
The Harris campaign’s smart choice of music coincides with a willingness to lean into a meme culture that shot up organically around the 59-year-old VP since President Biden announced Sunday that he was dropping out of the race.
Pop star Charli XCX showed her support for Harris when she tweeted “Kamala IS brat.” The British singer is referring to the TikTok and Twitter edits of Harris’ image superimposed to songs from Charli XCX’s hit album “Brat.” The avalanche of memes come from a video clip in which Harris talks about her mother’s response to the hubris of youth: “You think you just fell out of a coconut tree? You exist in the context of all in which you live and what came before you.”
Right-wing social media used the quote to deride Harris as inarticulate and a “word salad” master, but liberal swaths of Gen Z have since reworked the clip into emojis and memes that celebrate Harris’ nonconformist approach. She’s become a viral sensation, in a good way, unlike J.D. Vance’s damning “single cat lady” memes and a cringey internet joke about encounters with couches.
It’s rare that relevant talent will shill for a Republican candidate. Case in point: Trump’s pop culture ambassadors at this year’s RNC were Kid Rock, Kanye’s ex Amber Rose and former WWE wrestler Hulk Hogan, whose big moment was ripping his shirt off and screaming “Let Trump mania run wild!”
Harris chose to let freedom ring, and she has Queen Bey behind her.
Politics
Texas sues Biden administration over program giving birth control to teens without parents' knowledge

Texas officials are challenging a recent order from President Biden’s administration that would allow schools to distribute birth control to teenagers without parental consent.
Texas Attorney General Ken Paxton announced Thursday that his office is suing the Biden administration over their 2021 change to Title X guidelines banning parental consent requirements for birth control services.
“By attempting to force Texas healthcare providers to offer contraceptives to children without parental consent, the Biden Administration continues to prove they will do anything to implement their extremist agenda — even undermine the Constitution and violate the law,” Paxton said in a statement.
TRUMP SAYS HE ‘WILL NEVER ADVOCATE IMPOSING RESTRICTIONS ON BIRTH CONTROL’ OR OTHER CONTRACEPTIVES
A woman takes the next pill from a monthly pack of contraceptive pills. (Annette Riedl/picture alliance via Getty Images)
The Texas legal battle began in Dec. 2021 when US District Judge Matthew Kacsmaryk ruled that Title X — the federal program that provides free, confidential contraception to anyone regardless of age, income or immigration status — violates parental rights and violates state and federal laws.
The case was argued by former solicitor general of Texas Jonathan Mitchell, representing father Alex Deanda, who said he was “raising each of his daughters in accordance with Christian teaching on matters of sexuality, which requires unmarried children to practice abstinence and refrain from sexual intercourse until marriage.”
SCHUMER PLANS VOTE ON ‘CONSTITUTIONAL RIGHT TO CONTRACEPTION’ IN BID TO PROTECT SENATE DEMOCRAT MAJORITY
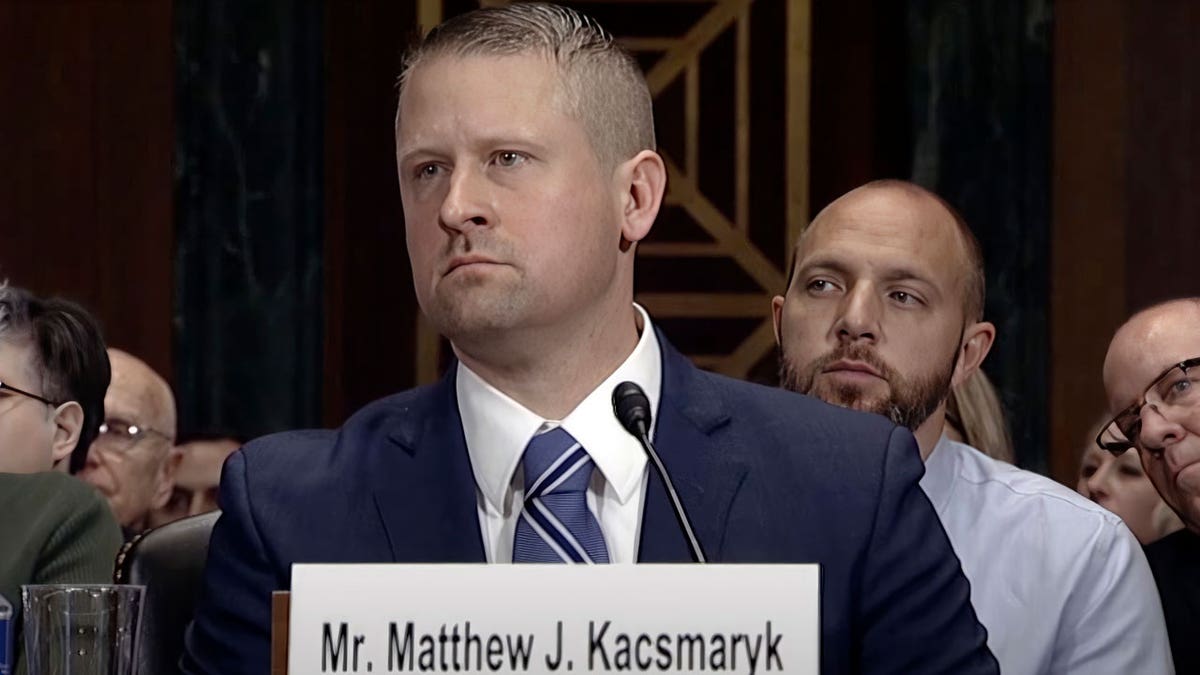
Kacsmaryk, a Trump appointee, previously ruled that parents must be informed when birth control is provided to their children under 18 years old. (Senate Judiciary Committee via AP)
In response, the federal government updated guidelines to state that Title X projects “may not require consent of parents or guardians for the provision of services to minors, nor can any Title X project staff notify a parent or guardian before or after a minor has requested and/or received Title X family planning services.”
Paxton is now seeking a permanent injunction on this rule, which he claims defies the findings of the federal court.
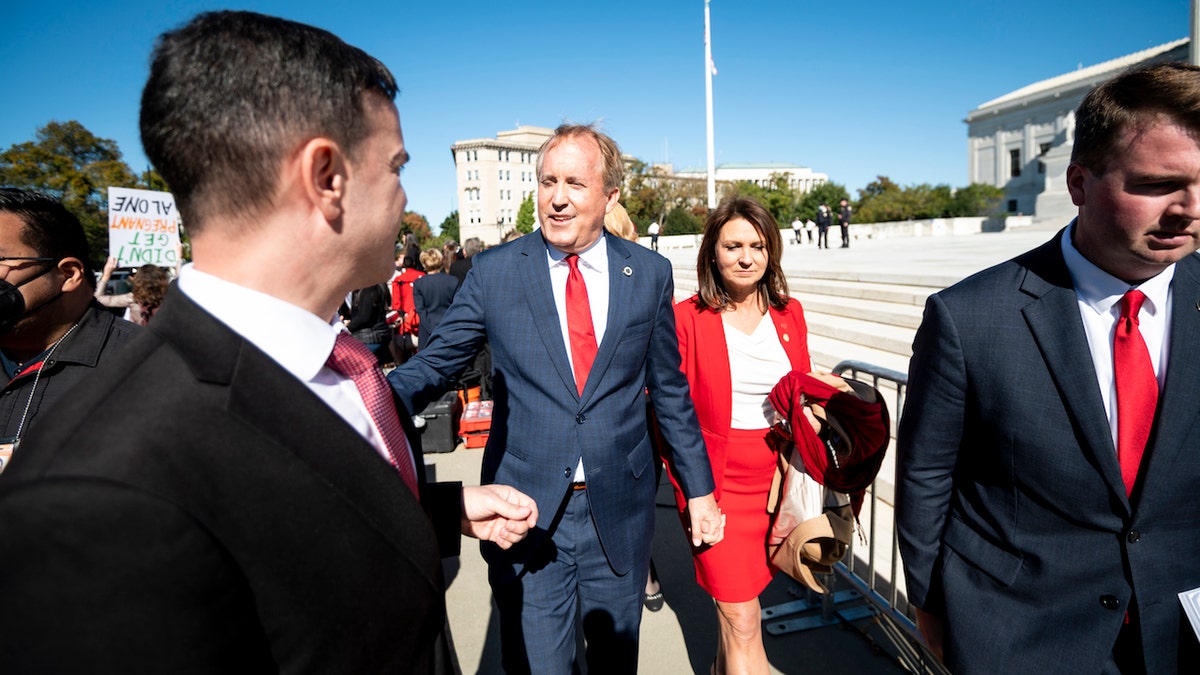
Paxton and his wife Angela are pictured outside the Supreme Court. (Bill Clark/CQ-Roll Call, Inc via Getty Images)
Paxton filed the lawsuit in a federal court in Amarillo. It will likely be heard by Kacsmaryk, the same judge who previously ruled parents must be informed of birth control provided to their children.
-

 World1 week ago
One dead after car crashes into restaurant in Paris
-

 Midwest1 week ago
Michigan rep posts video response to Stephen Colbert's joke about his RNC speech: 'Touché'
-

 News1 week ago
Video: Young Republicans on Why Their Party Isn’t Reaching Gen Z (And What They Can Do About It)
-

 Movie Reviews1 week ago
Movie Review: A new generation drives into the storm in rousing ‘Twisters’
-

 News1 week ago
In Milwaukee, Black Voters Struggle to Find a Home With Either Party
-
 Politics1 week ago
Fox News Politics: The Call is Coming from Inside the House
-

 News1 week ago
Video: J.D. Vance Accepts Vice-Presidential Nomination
-

 World1 week ago
Trump to take RNC stage for first speech since assassination attempt


