News
New rules will protect California workers from dangerous heat indoors

Warehouses in California can get dangerously hot. The state just passed a rule protecting people who work indoors in industries like warehousing, restaurants or manufacturing from excessive heat.
Virginie Goubier/AFP via Getty Images
hide caption
toggle caption
Virginie Goubier/AFP via Getty Images
California’s Occupational Health and Safety (Cal/OSHA) Standards Board voted Thursday afternoon to implement rules protecting indoor workers from extreme heat.
California now joins just a few other states, including Oregon and Minnesota, to protect people who work indoors in facilities like warehouses, restaurants and refineries. The state estimates the new rule will apply to about 1.4 million people who work indoors in conditions that can easily become dangerously hot.
“It’s an urgent public health crisis, the impact of heat on health, as we’re seeing across the country,” says Laura Stock, a former Cal/OSHA Standards Board member and the director of the Labor Occupational Health Program at the University of California, Berkeley. “There was an urgent need for this regulation. It’s in line with what we already have in California, which is the recognition that heat is a life-threatening exposure hazard.”
Now, when indoor temperatures hit 82 degrees Fahrenheit, employers will be required to provide employees with cool places to take breaks. Above 87 degrees, they’ll need to change how people work. That could mean shifting work activities to cooler times of the day, for example, or cooling down workspaces using tools like fans or air conditioning.
The rule could be implemented by early August, says Eric Berg, Cal/OSHA’s deputy chief of health and research and standards.
That can’t come quickly enough for workers facing dangerously hot weather already, says Tim Shadix, legal director of the Warehouse Worker Resource Center, a worker advocacy group based in Southern California.
“In the worst places we’ve seen, you know, in the summer, those workplaces, they’re kind of like a tin can baking in the sun,” Shadix says. “We hope there are no further delays and employees and employers are informed of these new protections before summer’s end.”
Early June saw record-breaking temperatures across the state, well above 100 degrees in some inland regions home to thousands of warehouses. Scientists from the World Weather Attribution group recently determined that June’s heat wave was longer, hotter and 35 times more likely to occur than in a world without human-caused climate change.
Sarah Fee used to work in warehouses in the Inland Empire, in Southern California. Outdoor temperatures regularly hover in the 90s or above during the summer, and many warehouses are as hot, or sometimes hotter, than the outdoors.
“I would leave work, my shirt would be soaked in sweat, and I would be absolutely nauseous,” she says. “Fans weren’t enough.”
A spotty patchwork of heat rules nationwide
There are no national rules protecting workers, outdoors or indoors, from dangerous heat. Employers are required to provide workplaces “free from recognized hazards” under the federal Occupational Health and Safety Administration’s General Duty clause, including heat, but worker advocates point out that the guidelines on heat-specific risk are challenging to enforce and have been used infrequently.
In the absence of robust federal guidance, individual cities like Phoenix, Ariz., and five states, including Oregon, Washington and Minnesota, have created their own regulations that give outdoor workers, like farmworkers or construction workers, rights to water breaks and access to shade when temperatures soar.
But others have explicitly blocked such rules. Earlier this year, Miami-Dade County in Florida was on the cusp of proposing a local rule to address heat risk for outdoor laborers. But Gov. Ron DeSantis signed a state law banning cities or counties from making their own heat rules.
OSHA has been developing a national-scale heat rule that would protect both indoor and outdoor workers, but the process could take years. A draft was recently sent to the White House for review.
California’s adoption of the indoor heat rule is “a really an important step, and a signal to other states and employers that this is really something to pay attention to,” says Jill Rosenthal, the director of public health policy at the Center for American Progress. “We hope to see that more states will take up these kinds of policies and again, for health reasons and also for economic reasons.”
In the meantime, workers in California and beyond are being hurt, and sometimes dying, from heat exposure.
A long road to indoor heat protection
In 2016, California lawmakers approved a bill tasking Cal/OSHA with creating a rule to protect people who worked indoors from heat exposure — a companion to the state’s 2005 law protecting outdoor workers. The state was supposed to create the rule by 2019, but conflict over its scope slowed the rule’s progress for years. The debates were over which industries the protections would cover, what actions would need to be taken after certain temperatures were reached and what businesses would be required to actively cool workplaces that were too hot.
The text for the rule was finalized earlier this year. The standards board was set to vote on it in March 2024, but the night before the vote, the board was informed that California’s Department of Finance had raised concerns about the cost to the state for complying with the rule — particularly about the effort required to get the California Department of Corrections and Rehabilitation (CDCR) into compliance. The department operates more than 30 adult state-owned facilities across the state, most of which are cooled by fans or evaporative coolers, not air conditioning.
At the March meeting, board members expressed their frustration with the last-minute delay and took a symbolic vote to approve the rule anyway.
The new version of the rule that passed Thursday now excludes CDCR. The Standards Board says it will work on developing a separate pathway to address those workers’ safety. But AnaStacia Nicol Wright, with the worker rights organization WorkSafe, worries the process could drag out, putting thousands of employees — and prisoners — at risk for another summer, or more. “Incarcerated workers are also employees under California labor code,” she said at the meeting. “These workers are at risk of heat exhaustion and dehydration, due to working in often archaic, poorly ventilated buildings with little protection from temperatures.”
Some employer groups still object to components of the rule. Rob Moutrie, from the California Chamber of Commerce, noted that many small businesses that rent their facilities don’t control their own infrastructure, making it difficult or impossible to provide the cool-down spaces the new rule requires.
Bryan Little, director of labor affairs with the California Farm Bureau, pointed out that groups like his had similar concerns to Corrections about the potentially prohibitive costs of installing and using “engineering controls,” like air conditioning, to cool workplaces. “As an employer advocate, I wonder what it takes to get heard,” he said in the meeting.
The rule could be in place by late summer. The sooner, the better, says Stock.
“I think the urgency of this is really evident,” she says. “The impact of climate change on temperature is just exacerbating the exposure, and temperatures are higher for more months.”


Former president Bill Clinton is scheduled to give deposition Friday to a congressional committee investigating his links to Jeffrey Epstein, one day after Hillary Clinton testified before the committee and called the proceedings “partisan political theatre” and “an insult to the American people”.
During remarks before the House oversight committee, Hillary Clinton, the former secretary of state, insisted on Thursday that she had never met Epstein.
The former Democratic president, however, flew on Epstein’s private jet several times in the early 2000s but said he never visited his island.
Clinton, who engaged in an extramarital affair while president and has been accused of sexual misconduct by three women, also appears in a photo from the recently released files, in a hot tub with Epstein and a woman whose identity is redacted.
Clinton has denied the sexual misconduct claims and was not charged with any crimes. He also has not been accused of any wrongdoing connected to Epstein.
Epstein visited the White House at least 17 times during the early years of Clinton’s presidency, according to White House visitor records cited in news reports. Clinton said he cut ties with him around 2005, before the disgraced financier, who died from suicide in 2019, pleaded guilty to solicitation of a minor in Florida.
The House committee subpoenaed the Clintons in August. They initially refused to testify but agreed after Republicans threatened to hold them in contempt.
The Clintons asked for their depositions to be held publicly, with the former president stating that to do so behind closed doors would amount to a “kangaroo court”.
“Let’s stop the games + do this the right way: in a public hearing,” Clinton said on X earlier this month.
The committee’s chair, James Comer, did not grant their request, and the proceedings will be conducted behind closed doors with video to be released later.
On Thursday, Hillary Clinton’s proceedings were briefly halted after representative Lauren Boebert leaked an image of Clinton testifying.
During the full day deposition, Clinton said she had no information about Epstein and did not recall ever meeting him.
Before the deposition, Comer said it would be a long interview and that one with Bill Clinton would be “even longer”.


CASE 0:26-cv-00107-PJS-DLM
Doc. 12-1 Filed 02/26/26
Page 5 of 17
and to file a status update by 11:00 am on January 20. ECF No. 5. Respondents never provided a bond hearing and did not release Petitioner until January 21, ECF Nos. 10, 12, after failing to file an update, ECF No. 9. Further, Respondents released Petitioner subject to conditions despite the Court’s release order not providing for conditions. ECF Nos. 5, 12–13.
Abdi W. v. Trump, et al., Case No. 26-CV-00208 (KMM/SGE)
On January 21, 2026, the Court ordered Respondents, within 3 days, to either (a) complete Petitioner’s inspection and examination and file a notice confirming completion, or (b) release Petitioner immediately in Minnesota and confirm the date, time, and location of release. ECF No. 7. No notice was ever filed. The Court emailed counsel on January 27, 2026, at 10:39 am. No response was provided.
Adriana M.Y.M. v. David Easterwood, et al., Case No. 26-CV-213 (JWB/JFD)
On January 24, 2026, the Court ordered immediate release in Minnesota and ordered Respondents to confirm the time, date, and location of release, or anticipated release, within 48 hours. ECF No. 12. Respondent was not released until January 30, and Respondents never disclosed the time of release, instead describing it as “early this morning.” ECF No. 16.
Estefany J.S. v. Bondi, Case No. 26-CV-216 (JWB/SGE)
On January 13, 2026, at 10:59 am, the Court ordered Respondents to file a letter by 4:00 pm confirming Petitioner’s current location. ECF No. 8. After receiving no response, the Court ordered Respondents, at 5:11 pm, to immediately confirm Petitioner’s location and, by noon on January 14, file a memorandum explaining their failure to comply with the initial order. ECF No. 9. Respondents did not file the memorandum, requiring the Court to issue another order. ECF No. 12. On January 15, the Court ordered immediate release in Minnesota and required Respondents to confirm the time, date, and location of release within 48 hours. ECF No. 18. On January 20, having received no confirmation, the Court ordered Respondents to comply immediately. ECF No. 21. Respondents informed the Court that Petitioner was released in Minnesota on January 17, but did not specify the time. ECF No. 22.
5

James Hickman holds a photo montage of the late Rev. Jesse Jackson before a public visitation at Rainbow/PUSH Coalition in Chicago on Thursday.
Nam Y. Huh/AP
hide caption
toggle caption
Nam Y. Huh/AP
CHICAGO — A line of mourners streamed through a Chicago auditorium Thursday to pay final respects to the Rev. Jesse Jackson Sr. as cross-country memorial services began in the city the late civil rights leader called home.
The protege of the Rev. Martin Luther King Jr. and two-time presidential candidate will lie in repose for two days at the headquarters of the Rainbow PUSH Coalition before events in Washington, D.C., and South Carolina, where he was born.
Family members wiped away tears as the casket was brought into the stately brick building. Flowers lined the sidewalks where people waiting to enter watched a large screen playing video excerpts of Jackson’s notable speeches. Some raised their fists in solidarity.
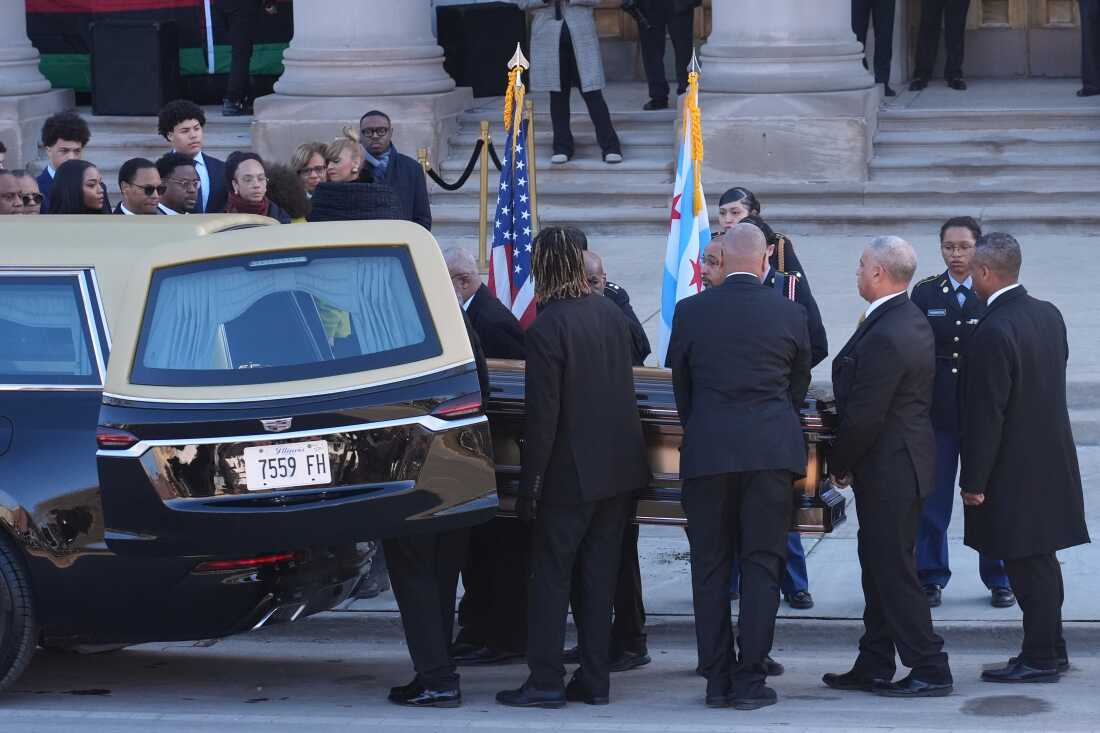
The casket with the Rev. Jesse Jackson arrives before a public visitation at Rainbow/PUSH Coalition in Chicago on Thursday.
Nam Y. Huh/AP
hide caption
toggle caption
Nam Y. Huh/AP
Inside, Jackson’s children, Chicago Mayor Brandon Johnson and the Rev. Al Sharpton were among those who stood by the open casket to shake hands and hug those coming to view the body of Jackson, dressed in a suit and blue shirt and tie.
“The challenge for us is that we’ve got to make sure that all he lived for was not in vain,” Sharpton told reporters. “Dr. King’s dream and Jesse Jackson’s mission now falls on our shoulders. We’ve got to stand up and keep it going.”

The Rev. Al Sharpton speaks as Jesse Jackson Jr. listens after the public visitation for the Rev. Jesse Jackson at Rainbow/PUSH Coalition in Chicago on Thursday.
Nam Y. Huh/AP
hide caption
toggle caption
Nam Y. Huh/AP
Jackson died last week at age 84 after battling a rare neurological disorder that affected his mobility and ability to speak in his later years.
Remembrances have already poured in from around the globe, and several U.S. states, including Minnesota, Iowa and North Carolina, are flying flags at half-staff in his honor.
But perhaps nowhere has his death been felt as strongly as in the nation’s third-largest city, where Jackson lived for decades and raised his six children, including a son who is a congressman.
Bouquets have been left outside the family’s Tudor-style home on the city’s South Side for days. Public schools have offered condolences, and city trains have used digital screens to display Jackson’s portrait and his well-known mantra, “I am Somebody!”

People wait to enter the security checkpoint for the public visitation for the Rev. Jesse Jackson at Rainbow/PUSH Coalition in Chicago on Thursday.
Nam Y. Huh/AP
hide caption
toggle caption
Nam Y. Huh/AP
His causes, both in the United States and abroad, were countless: Advocating for the poor and underrepresented on issues including voting rights, job opportunities, education and health care. He scored diplomatic victories with world leaders, and through his Rainbow PUSH Coalition, he channeled cries for Black pride and self-determination into corporate boardrooms, pressuring executives to make America a more open and equitable society.


“We honor him, and his hard-earned legacy as a freedom fighter, philosopher, and faithful shepherd of his family and community here in Chicago,” the mayor said in a statement.
Next week, Jackson will lie in honor at the South Carolina Statehouse, followed by public services. According to Rainbow PUSH’s agenda, Gov. Henry McMaster is expected to deliver remarks; however, the governor’s office said Thursday that his participation wasn’t yet confirmed. Jackson spent his childhood and started his activism in South Carolina.
Details on services in Washington have not yet been made public. However, he will not lie in honor at the United States Capitol rotunda after a request for the commemoration was denied by the House Speaker Mike Johnson’s office.
The two weeks of events will wrap up next week with a large celebration of life gathering at a Chicago megachurch and finally, homegoing services at the headquarters of the Rainbow PUSH Coalition.
Family members said the services will be open to all.
“Our family is overwhelmed and overjoyed by the amazing amount of support being offered by common, ordinary people who our father’s life has come into contact with,” his eldest son, Jesse Jackson Jr., said before the services began. “This is a unique opportunity to lay down some of the political rhetoric and to lay down some of the division that deeply divides our country and to reflect upon a man who brought people together.”
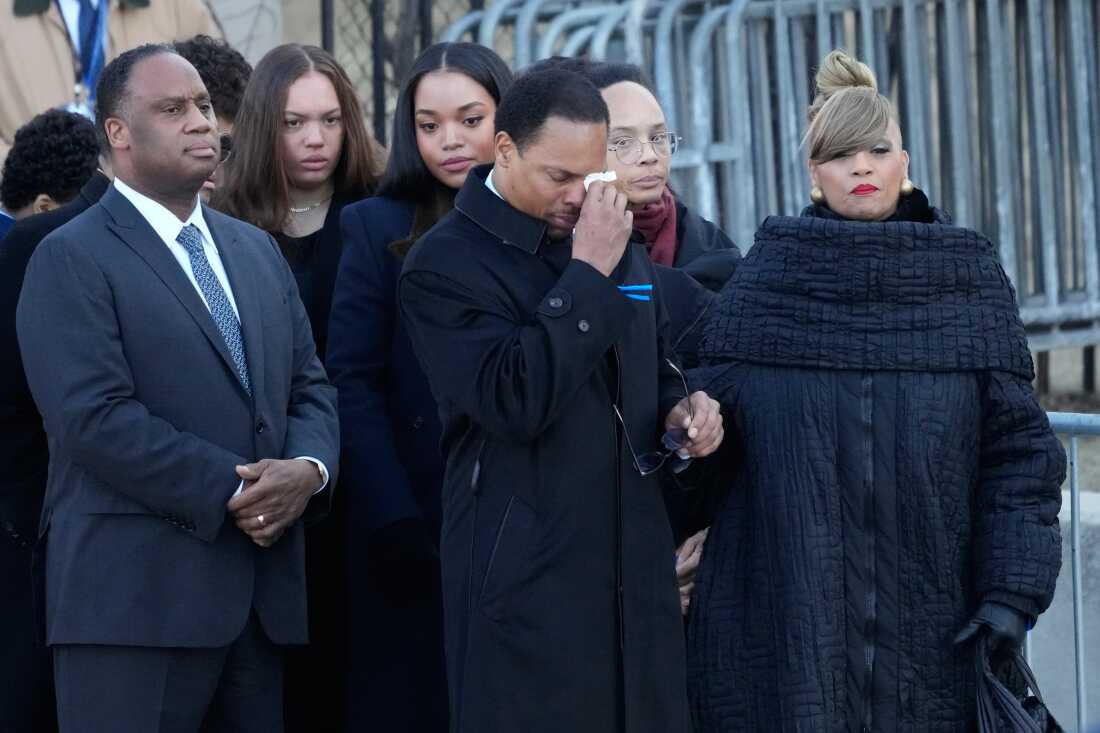
The family of the Rev. Jesse Jackson arrives as Yusep Jackson wipes his eyes before public visitation at Rainbow/PUSH Coalition in Chicago on Thursday.
Nam Y. Huh/AP
hide caption
toggle caption
Nam Y. Huh/AP
The services included prayers from some of the city’s most well-known religious leaders, including Chicago Cardinal Blase Cupich. Mourners of all ages — from toddlers in strollers to elderly people in wheelchairs — came to pay respects.
Video clips of his appearances at news conferences, the campaign trail and even “Sesame Street” also played inside the auditorium.
Claudette Redic, a retiree who lives in Chicago, said her family has respected Jackson, from backing his presidential ambitions to her son getting a scholarship from a program Jackson championed.
“We have generations of support,” she said. “I’m hoping we continue.”

Baz Luhrmann will make you fall in love with Elvis Presley

Here’s your first look at Kratos in Amazon’s God of War show

State Dept authorizes non-essential US Embassy personnel in Jerusalem to depart ahead of possible Iran strikes

Where Iran’s ballistic missiles can reach — and how close they are to the US

Heart disease threat projected to climb sharply for key demographic

Florida High School Football Rankings: Top 25 teams – Oct. 21

Cleary's 21 help Le Moyne down Central Connecticut State 69-64 in OT

How old is Bo Nix? What to know about Oregon quarterback ahead of 2024 NFL Draft

99th annual Pony Swim held in Virginia

Indiana Members Credit Union announced as new anchor tenant at Bottleworks District
Where Iran’s ballistic missiles can reach — and how close they are to the US

Has India’s influence in Afghanistan grown under the Taliban?

Bill Clinton to testify before House committee investigating Epstein links

Read Judge Schiltz’s Order

Vulnerable House Dem lashes out at Trump’s ‘racist’ SOTU challenge: ‘That was uncomfortable’
-

 World1 day ago
Exclusive: DeepSeek withholds latest AI model from US chipmakers including Nvidia, sources say
-

 Massachusetts2 days ago
Mother and daughter injured in Taunton house explosion
-

 Montana1 week ago
2026 MHSA Montana Wrestling State Championship Brackets And Results – FloWrestling
-

 Oklahoma1 week ago
Wildfires rage in Oklahoma as thousands urged to evacuate a small city
-

 Louisiana4 days ago
Wildfire near Gum Swamp Road in Livingston Parish now under control; more than 200 acres burned
-

 Technology6 days ago
YouTube TV billing scam emails are hitting inboxes
-

 Denver, CO2 days ago
10 acres charred, 5 injured in Thornton grass fire, evacuation orders lifted
-

 Technology6 days ago
Stellantis is in a crisis of its own making