Crypto
Forex and Cryptocurrency Forecast – Action Forex

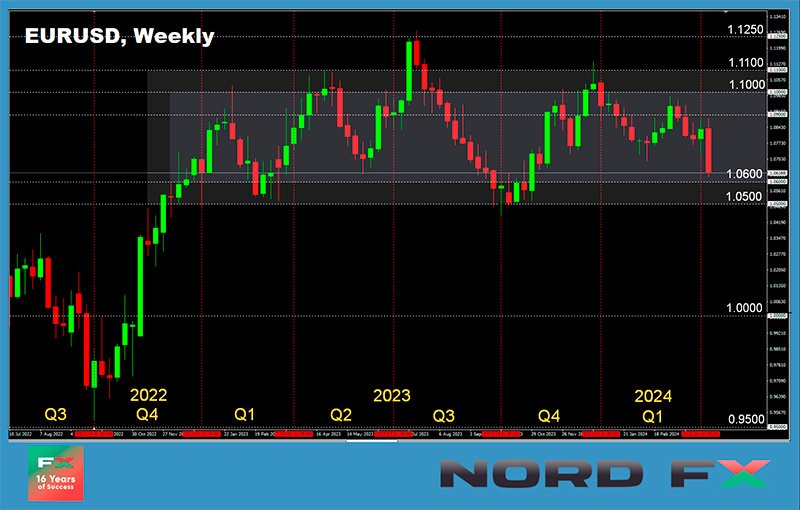
EUR/USD: The Dollar Soars
Last week saw two significant events: the first shocked market participants, while the second passed without surprises. Let’s examine the details in order.
Since mid-2022, consumer prices in the US have been declining. In July 2022, the Consumer Price Index (CPI) was at 9.1%, but by July 2023, it had fallen to 3.0%. However, in October, the CPI rose to 3.7%, then decreased again, and by February 2024, it had dropped to 3.2%. As a result, there was a general perception that inflation had finally been brought under control. The market consensus was that the Federal Reserve would soon begin to ease its monetary policy and start reducing interest rates in June. Two weeks ago, the likelihood of this move was estimated at 70%. The DXY index began to fall, reaching a local low of 103.94 on 9 April. However, the dollar bears’ joy was short-lived, as fresh US inflation data released on Wednesday, 10 April, quickly changed the sentiment.

In annual terms, the Consumer Price Index (CPI) rose to 3.5%, marking the highest level in six months. The main drivers of this inflation increase were the rises in rental costs (5.7%) and transportation expenses (10.7%), which clearly caught the markets by surprise. The chances of a rate cut in June plummeted to zero, and the DXY dollar index soared, reaching a peak of 105.23 on the evening of 10 April. Alongside this, the yield on 10-year US Treasury bonds grew to 4.5%. As is typical in such scenarios, stock indices such as the S&P 500, Dow Jones, and Nasdaq declined, and the EUR/USD pair, after dropping over 150 points, fell to 1.0728.
Austan Goolsbee, President of the Chicago Federal Reserve Bank, stated that although the regulator is confidently moving towards its 2.0% inflation target, the Federal Reserve leadership still has much work to do to reduce inflation. His colleague, John Williams, President of the New York Fed, noted that the latest inflation data were disappointing and added that economic prospects remain uncertain.
As a result of these and other statements, it is now forecasted that the Fed will begin cutting interest rates only in September. Moreover, investors expect there will be only two rate cuts this year, not three. Some believe that there may not be any rate cuts at all in 2024. However, according to US President Joe Biden, the Fed should still lower the rate in the second half of this year. His insistent request is quite understandable on the eve of the presidential elections. Firstly, it would reduce the cost of servicing the country’s enormous national debt, and secondly, it would symbolize a victory over inflation, giving Biden several additional points in the battle for the White House.
After the American inflation reaction, markets took a brief pause, awaiting the European Central Bank (ECB) governing council meeting on 11 April. The ECB has held rates steady at 4.50% since September 2023, which was in line with market expectations as forecasted by all 77 economists surveyed by Reuters. Thus, after some fluctuation, EUR/USD returned to its pre-ECB meeting level.
The ECB press release affirmed the council’s firm intention to return inflation to a medium-term target of 2.0% and believed that the key rates contribute significantly to the ongoing disinflation process. Future decisions will ensure that the key rates remain at sufficiently restrictive levels as long as necessary.
It’s worth noting that inflation in the 20 Eurozone countries was at 2.4% in March, slightly above the target of 2.0%. In February, the rate was 2.6%, and in January it was 2.8%. Economists surveyed by Reuters believe that inflation will continue to decrease in the coming quarters, but it will not reach 2.0% before the second quarter of 2025.
Christine Lagarde, the head of the European Central Bank (ECB), expressed a similar view during a press conference. However, she mentioned that since the Eurozone economy remains weak, to support it, the ECB will not wait for inflation to return to the 2.0% level at every point. Thus, Ms. Lagarde did not rule out that the regulator might start easing its monetary policy significantly before 2025. Strategists from the Italian bank UniCredit forecast that the ECB will cut rates three times this year, by 25 basis points each quarter. The pace of reduction could remain the same next year. Economists from Deutsche Bank also expect that the pan-European regulator will start cutting rates before the Federal Reserve and will do so at a faster pace. Consequently, the widening interest rate differential between the US and the Eurozone will contribute to the weakening of the euro.
This medium-term forecast was confirmed last Friday: EUR/USD continued its decline, reaching a local minimum of 1.0622 and closing the five-day period at 1.0640. The DXY index peaked at 106.04. As for the near-term outlook, as of the evening of 12 April, 40% of experts anticipate an upward correction of the pair, while the majority (60%) hold a neutral position. Among the oscillators on D1, only 15% are coloured green, and 85% are red, although a quarter of them are in the oversold zone. Trend indicators are 100% bearish. The nearest support levels for the pair are located in the zones 1.0600-1.0620, followed by 1.0495-1.0515, 1.0450, 1.0375, 1.0255, 1.0130, and 1.0000. Resistance zones are situated at levels 1.0680-1.0695, 1.0725, 1.0795-1.0800, 1.0865, 1.0895-1.0925, 1.0965-1.0980, 1.1015, 1.1050, 1.1100-1.1140.
Next week, on Monday, 15 April, US retail sales data will be released. On Wednesday, it will become clear what is happening with consumer inflation in the Eurozone. It is likely that the refined data will confirm the preliminary results, and the Consumer Price Index (CPI) for March will be reported at 2.4% year-on-year. On Thursday, we traditionally expect data on the number of initial jobless claims from US residents and the Philadelphia Fed Manufacturing Index.
GBP/USD: The Pound Plummets
On Friday, 12 February, the UK’s GDP data indicated that the economy is on the path to recovery. Although production has declined compared to last year, the latest data suggests that exiting the shallow recession is quite likely. GDP has grown for the second consecutive month, with the Office for National Statistics (ONS) reporting a 0.1% increase in February on a monthly basis, with January’s figures revised upwards to show a 0.3% growth from an earlier 0.2%.
Despite these figures, GBP/USD fell below the key 1.2500 mark due to crumbling hopes for an imminent Fed rate cut. Not even a statement from Bank of England (BoE) Monetary Policy Committee member Megan Greene, which highlighted that inflation risks in the UK remain significantly higher than in the US and that markets are mistaken in their rate cut forecasts, could change the situation. “Markets have leaned towards the Fed not cutting rates so soon. In my view, the UK will also not see rate cuts anytime soon,” she wrote in her Financial Times column.
Following Greene’s remarks, traders now expect no more than two rate cuts from the Bank of England this year, each by 25 basis points. However, this revised forecast did little to support the pound against the dollar, with GBP/USD ending the week at 1.2448.
Analysts are split on the short-term behaviour of GBP/USD: 50% voted for a rebound to the north, and 50% abstained from forecasting. Indicator readings on D1 suggest the following: among oscillators, 10% recommend buying, another 10% are neutral, and 80% indicate selling, with 20% of these signalling oversold conditions. All trend indicators are pointing downwards. If the pair continues south, it will encounter support levels at 1.2425, 1.2375-1.2390, 1.2185-1.2210, 1.2110, and 1.2035-1.2070. In the event of an increase, resistance will be found at levels 1.2515, 1.2575-1.2610, 1.2695-1.2710, 1.2755-1.2775, 1.2800-1.2820, 1.2880-1.2900, 1.2940, 1.3000, and 1.3140.
The most significant days for the British currency next week will be Tuesday and Wednesday. Extensive labor market data from the United Kingdom will be released on Tuesday, 16 April, along with a speech from the Governor of the Bank of England, Andrew Bailey. Wednesday, 17 April, could be even more turbulent and volatile as consumer inflation (CPI) data for the country will be published.
USD/JPY: Is 300.00 Just a Matter of Time?
Bears on USD/JPY continue to hope for its reversal southwards, yet the pair does not stop climbing. Our previous review titled “A Break Above 152.00 – A Matter of Time?” proved true within a very short period. Last week, the pair reached a 34-year high of 153.37, propelled by US inflation reports and increases in the DXY index and yields on 10-year US treasuries. (Considering that it traded above 300.00 in 1974, this is still not the limit).
This surge occurred despite another round of verbal interventions from high-ranking Japanese officials. Finance Minister Suzuki Shunichi reiterated his concern over excessive currency movements and did not rule out any options to combat them. Cabinet Secretary Yoshimasa Hayashi echoed these sentiments almost verbatim. However, the national currency no longer pays any attention to such statements. Only real currency interventions and significant steps towards tightening monetary policy by the Bank of Japan (BoJ) could help, but these have yet to occur.
Analysts at Dutch Rabobank believe the Japanese Ministry of Finance will eventually be forced to act to prevent the price from reaching 155.00. “While a breakthrough of the 152.00 level by USD/JPY might not immediately trigger currency interventions, we see a significant likelihood of such a step,” they write. “Assuming that the Bank of Japan may announce a second rate hike later this year and considering expectations that the Fed will indeed cut rates in 2024, Rabobank expects USD/JPY to trade around 150.00 on a monthly horizon and 148.00 on a 3-month horizon.”.
Last week, the pair closed at 152.26. Regarding its near future, 25% of experts sided with the bears, another 25% remained neutral, and the remaining 50% voted for further strengthening of the US currency and a rise in the pair. Technical analysis tools are apparently unaware of the fears regarding possible currency interventions, so all 100% of trend indicators and oscillators on D1 are pointing north, with a quarter of them now in the overbought zone. The nearest support level is around 152.75, followed by 151.55-151.75, 150.80-151.15, 149.70-150.00, 148.40, 147.30-147.60, and 146.50. Defining resistance levels after the pair updated 34-year highs is challenging. The nearest resistance lies in the zone 153.40-153.50, followed by levels 154.40 and 156.25. According to some analysts, the monthly high of June 1990 at around 155.80 and then the reversal high of April 1990 at 160.30 can also serve as references.
No significant events or publications regarding the state of the Japanese economy are planned for the upcoming week.
CRYPTOCURRENCIES: On the Eve of Hour X
The next halving, when the reward for mining a BTC block will again be halved, is scheduled for Saturday, 20 April. Although this date is approximate and may shift a day or two either way, the closer the Hour X, the hotter the discussions about how the price of the main cryptocurrency will behave before and after this event.
Historically, the value of bitcoin has risen after halvings: it surged by nearly 9000% to $1162 in 2012, by about 4200% to $19800 in 2016, and by 683% to $69000 following the previous halving in May 2020. However, it then crashed to nearly $16,000.
Lucas Kiely, CIO of the financial platform Yield App, believes that we should not expect a seven-fold increase in the price of bitcoin after the upcoming halving. According to Kiely, during the three previous cycles, the halving of miners’ rewards heralded a massive increase in volatility levels. After the halving, BTC fell by 30-40% but then soared to unprecedented heights within 480 days. However, this year, he suspects, the cryptocurrency’s flight to the Moon will not occur.
Kiely predicts that bitcoin will update its historical maximum reached this March at $73,743. However, the new peak will not exceed the previous one by as much as before, due to the low level of volatility. The specialist attributes the drop in volatility to two factors: 1. an increase in the number of bitcoins in the wallets of hodlers, who own more than 70% of the issued coins, and 2. the creation of spot Bitcoin ETFs, which remove a huge amount of coins from circulation. (In the three months since their inception, the capitalization of 10 such ETFs (excluding the Grayscale fund) has exceeded $12 billion). As a result, bitcoin is becoming a more traditional asset that is less risky but also less likely to yield massive profits. Kiely believes that this factor makes the coin more attractive to institutional investors and older people who prefer to invest in reliable assets and are not interested in gambling.
Ex-CEO of the BitMEX exchange, Arthur Hayes, expects a price drop. In his view, the halving is certainly a bullish catalyst for the crypto market in the medium term. However, prices might fall immediately before and after the event. “The narrative that the halving of block rewards will positively affect cryptocurrency prices has firmly taken root,” says the expert. “However, when most market participants agree on a certain outcome, the opposite usually happens.”
Hayes noted that the market would face a reduction in US dollar liquidity in the second half of April, driven by tax season, Fed policies, and the strengthening of the US Treasury’s balance sheet. This reduction in liquidity will provide additional stimulus for a “furious sell-off of cryptocurrencies,” he believes. “Can the market defy my bearish forecasts and continue to grow? I hope so. I have been involved with cryptocurrency for a long time, so I welcome being proven wrong.”
The situation before this halving is indeed very different from before. This change is linked to the large influx of institutional investors through the newly launched Bitcoin ETFs in early January. The influence of ETFs on spot trading is clearly reflected in the reduced market activity on weekends and US public holidays when the exchange funds do not operate. The tax season has also significantly impacted the market for risky assets. Over the last two weeks, inflows into these funds have been significantly below the average mark of $203 million, with recent days seeing an outflow of funds from Grayscale and Ark Invest. Other ETFs are also reporting reduced inflows. All this suggests that Arthur Hayes’ concerns are well-founded, and a 30% drop from the current price could send bitcoin down to around $50,000.
Miners, who will lose half their income after the halving, while the costs of obtaining the same amount of coins will increase, could also contribute to a market crash. After the halving in May 2020, the costs of mining rose to $30,000. Currently, the average cost of mining one BTC is $49,900, but after 20 April, according to Ki Young Ju, CEO of the analytical platform CryptoQuant, it will exceed $80,000. Therefore, the asset must trade above this level for miners to continue making any profit. However, as previously mentioned, a rapid price surge may not occur. This means that small mining companies and individual miners are facing a wave of bankruptcies and acquisitions.
According to Arthur Hayes, the situation might improve in May-June: the US Treasury will “most likely release an additional $1 trillion of liquidity into the system, which will pump the markets,” he says. Anthony Scaramucci, CEO of Skybridge, also holds that spot Bitcoin ETFs, acting as “selling machines,” will continue to stimulate demand for the first cryptocurrency from both retail customers and institutional investors. Scaramucci believes that in this cycle, bitcoin’s value could increase by 2.5 times, and then continue to rise. “I’m just saying that the capitalization of bitcoin could reach half that of gold, i.e., increase six or even eight times from its current levels,” the businessman declared. It’s noteworthy that the current capitalization of bitcoin stands at $1.35 trillion, while gold’s is at $15.8 trillion. Thus, if BTC reaches half the capitalization of the precious metal, its price would be around $400,000 per coin.
Brad Garlinghouse, CEO of Ripple, also places his hopes on spot Bitcoin ETFs. According to him, BTC-ETFs have attracted real institutional investments into the industry for the first time, so he is “very optimistic” about the macroeconomic trends in the crypto industry. In this context, Garlinghouse allowed that the market capitalization of digital assets could double by the end of the year, exceeding $5.0 trillion.
As of the evening of Friday, 12 April, BTC/USD is trading at around $66,900. The total capitalization of the crypto market is $2.44 trillion ($2.53 trillion a week ago). The Crypto Fear and Greed Index remains in the Extreme Greed zone at 79 points.
In conclusion, a bit of curious statistics: In anticipation of the halving, Deutsche Bank conducted a survey regarding the future price of bitcoin. 15% of respondents stated that within this year, BTC would trade in the range above $40,000 but below $75,000. A third of respondents were confident that the value of the main cryptocurrency would fall below $20,000 early in the next year. Meanwhile, 38% of those surveyed believed that BTC would cease to exist in the market altogether. And finally, about 1% of respondents called bitcoin a complete misunderstanding and speculation.


(NewsNation) – A type of criminal activity known as “wrench attacks,” in which robbers physically coerce people into handing over their cryptocurrency holdings, is on the rise, according to crypto security firm CertiK.
Nik Seetharaman, the CEO of cyberdefense company Wraith Watch, recently told Nexstar’s NewsNation that he believes the increase in wrench attacks can be partly attributed to people flaunting their wealth online, which he noted makes it easier for criminals to identify and track down people with a lot of money.
“In the crypto community especially, you have this culture of, you know, flaunting your assets and … posting pictures of yourself in (places like) Ibiza and Bali,” Seetharaman explained.
He also pointed to improvements in digital security that make it so criminals “have no option but to basically hold you at gunpoint and say, ‘Enter your password into this phone right now or bad things are going to happen to you or your family.’”
NewsNation local affiliate KTLA reported that experts also say the decentralized nature of cryptocurrencies and the ability to transfer large sums in irreversible transactions make large account holders vulnerable to bad actors.
How big an issue are wrench attacks?
The name “wrench attacks” was popularized by an online comic that mocked how easily high-tech security can be undone by hitting someone with a wrench until they give up passwords, according to The Associated Press.
CertiK released a report in May detailing global instances of wrench attacks, which showed that between January and April 2026, it identified 43 incidents resulting in victims losing more than $101 million in cryptocurrency.
The firm said those incidents represent a 41% increase over the same period last year, and if the rate continues, “2026 will close with approximately 130 incidents and several hundred million dollars in losses.”
In 2025, CertiK tracked only 81 attacks that resulted in victims losing approximately $52 million, further indicating that wrench attacks are a growing issue.
Wealthy California crypto holders targeted in recent attacks
In November 2025, a San Francisco man was robbed of $13 million in digital currency after thieves posing as pizza delivery drivers forced their way into his home, bound him with duct tape, beat him with a firearm and threatened to cut off his fingers, KTLA reported, citing The San Francisco Chronicle.
Three attempted wrench attacks in Sunnyvale, San Jose and Los Angeles that occurred in the days and weeks following the San Francisco home invasion appear to be linked.
Potential wrench attack in Nancy Guthrie case?
NewsNation contributor and former FBI Special Agent Jennifer Coffindaffer believes Nancy Guthrie, the mother of “Today” host Savannah Guthrie, who has been missing for more than 100 days, could have been the victim of a wrench attack.
Coffindaffer wrote on X Tuesday that she has been “speaking about a Wrench Attack that took place literally about 90 minutes North of Nancy’s house the day before Nancy was attacked since early March.”
Guthrie was last seen at her home on Jan. 31 in Pima County, near Tucson, Arizona. She is believed to have been abducted, and investigators are scrutinizing messages that have been sent to media outlets, possibly from kidnappers, at least one of which made a bitcoin ransom demand.
Separately, TMZ received a series of communications from a person claiming to know who the kidnapper is, and that individual has demanded a $100,000 cryptocurrency payment.
NewsNation local affiliate KTLA, NewsNation’s Sean Noone and The Associated Press contributed to this report.

Key Takeaways
Still Some Time To Go Till The Bears Retreat
Bitcoin’s bear market may still have a year or more to run, according to Cryptoquant founder and chief executive Ki Young Ju, who spelled out the timeline in a post on X. “Once profit-taking cascades, Bitcoin investors’ PnL typically falls for about 18 months.” Ju wrote, using shorthand for aggregate investor profit and loss (PnL). “Since the trend turned in Oct 2025, the bear market could last until early 2027.”
His reasoning hinges on the direction of realized profits. Put simply, holders are still sitting on paper gains they are steadily cashing in, a dynamic that historically keeps pressure on price until that selling burns itself out. The PnL index he relies on blends several onchain valuation gauges (including the market-value-to-realized-value (MVRV) ratio and net unrealized profit and loss) into a single trend line that peaked around mid-2025 and has been sliding since.
The warning extends a position Ju has pressed for much of the past year, as he first declared bitcoin’s bull cycle over in 2025, citing a widening gap between the asset’s realized capitalization and its market capitalization.
Not Everyone, Including Cryptoquant’s Own Data, Agrees
The bleak timeline is far from settled even inside Ju’s own firm, as Cryptoquant’s Bull-Bear Cycle Indicator turned green on May 12 for the first time since March 2023, a signal that has historically coincided with the start of more constructive conditions.
Other analysts are more bullish still, with research firm K33 contending bitcoin’s roughly $60,000 February low already marked the maximum drawdown of this cycle (a decline of about 52% from the record $126,272 the asset printed on Oct. 6, 2025).
The split reveals a murky mid-cycle picture, because if Ju is right, traders face another grinding stretch before realized profits reset, and the next leg higher can begin. If the greening cycle indicator and steady ETF inflows win out, the bottom may already be in.
Either way, Ju has handed the market a clear tripwire to watch wherein the moment unrealized profits start climbing while realized profits fade, the 18-month clock he describes would finally be ready to flip.

The stablecoin industry has spent years trying to prove one thing above all else: that blockchain-based money can move faster, cheaper and more efficiently than the financial infrastructure it hopes to replace.
-

 Atlanta, GA5 minutes ago
Feds seek Atlanta judge’s recusal amid sex affair inquiry
-

 Minneapolis, MN8 minutes ago
Friends, family and community gather to honor Officer Jamal Mitchell with street dedication
-

 Indianapolis, IN20 minutes ago
IndyCar driver Felix Rosenqvist had the busiest week after winning the Indianapolis 500
-

 Pittsburg, PA22 minutes ago
Dirt bike rider killed in collision with bus in Homewood
-

 Augusta, GA28 minutes ago
Volunteers come together to clean up Augusta neighborhood
-

 Washington, D.C35 minutes ago
Texas man indicted in shooting near Washington Monument that left bystander hurt
-

 Cleveland, OH38 minutes ago
3 Options For the Cavaliers to Replace GM Mike Gansey
-

 Austin, TX42 minutes ago
One dead, victim unidentified after APD responds to deceased person call in South Austin

