News
Cross-Tabs: October 2024 Times/Siena Poll of Hispanic Registered Voters


How These Polls Were Conducted
Here are the key things to know about these polls:
• Interviewers spoke with 3,385 likely voters nationwide from Sept. 29 to Oct. 6, 2024.
• The national poll includes separate polls of 622 voters in Florida and 617 voters in Texas. The weight given to each of these groups in the national poll has been adjusted so that the overall results are reflective of the entire country.
• The poll also uses a polling technique to speak with more Black and Hispanic voters than the typical national poll. The technique, known as an oversample, enables more confident analysis of subgroups, such as Black men or younger Black voters. This method does not affect the top-level results of the final poll; in the overall poll of the nation, Black and Hispanic respondents are weighted down so that they represent the proper share of all voters and so their views are not overrepresented in the survey results.
• Times/Siena polls are conducted by telephone, using live interviewers, in both English and Spanish. Overall, about 98 percent of respondents were contacted on a cellphone for these polls.
• Voters are selected for the survey from a list of registered voters. The list contains information on the demographic characteristics of every registered voter, allowing us to make sure we reach the right number of voters of each party, race and region. For these polls, interviewers placed nearly 365,000 calls to nearly 150,000 voters.
• To further ensure that the results reflect the entire voting population, not just those willing to take a poll, we give more weight to respondents from demographic groups that are underrepresented among survey respondents, like people without a college degree. You can see more information about the characteristics of our respondents and the weighted sample at the bottom of the page, under “Composition of the Sample.”
• The margin of sampling error among likely voters is plus or minus 2.4 points for the national poll and about plus or minus five points for each state poll. In theory, this means that the results should reflect the views of the overall population most of the time, though many other challenges create additional sources of error. When the difference between two values is computed, such as a candidate’s lead in a race, the margin of error is twice as large.
If you want to read more about how and why The Times/Siena Poll is conducted, you can see answers to frequently asked questions and submit your own questions here.
Full Methodology
The New York Times/Siena College nationwide poll of 3,385 likely voters was conducted in English and Spanish on cellular and landline telephones from Sept. 29 to Oct. 6, 2024. The national poll includes separate polls of 622 voters in Florida and 617 voters in Texas. It uses a statistical technique known as an oversample to survey 589 Black voters, including 548 voters who identify as Black alone and 41 voters who identify as Black in combination with another race or ethnicity, and 902 voters of Hispanic descent, including 704 voters who identify as Hispanic or Latino alone and 198 voters who identify as Hispanic in combination. The weight given to each of these groups in the national poll has been adjusted so that the overall results are reflective of the entire country.
Nationally, the margin of sampling error is plus or minus 2.4 percentage points for the likely electorate and plus or minus 2.2 percentage points among registered voters. In Florida and Texas, the margin of sampling error among the likely electorate is 4.8 percentage points.
Among the sample of Hispanic voters, the margin of sampling error is plus or minus 4.5 points for the likely electorate and plus or minus 4.1 points among registered voters. For the Black sample, the margin of sampling error is plus or minus 5.6 points for the likely electorate and plus or minus 5.4 points for registered voters.
Sample
The survey is a response-rate-adjusted stratified sample of registered voters taken from the voter file maintained by L2, a nonpartisan voter-file vendor, and supplemented with additional voter-file-matched cellular telephone numbers from Marketing Systems Group. The sample was selected by The New York Times in multiple steps to account for differential telephone coverage, nonresponse and significant variation in the productivity of telephone numbers by state.
To adjust for noncoverage bias, the L2 voter file for each state was stratified by statehouse district, party, race, gender, marital status, household size, turnout history, age and homeownership. The proportion of registrants with a telephone number and the mean expected response rate were calculated for each stratum. The mean expected response rate was based on a model of unit nonresponse in prior Times/Siena surveys. The initial selection weight was equal to the reciprocal of a stratum’s mean telephone coverage and modeled response rate. For respondents with multiple telephone numbers on the L2 file, or with differing numbers from L2 and Marketing Systems Group, the number with the highest modeled response rate was selected.
Fielding
The sample was stratified according to political party, race and region. Marketing Systems Group screened the sample to ensure that the cellular telephone numbers were active, and the Siena College Research Institute fielded the poll, with additional fieldwork by ReconMR, the Public Opinion Research Laboratory at the University of North Florida, the Institute for Policy and Opinion Research at Roanoke College, the Center for Public Opinion and Policy Research at Winthrop University in South Carolina and the Survey Center at University of New Hampshire. Interviewers asked for the person named on the voter file and ended the interview if the intended respondent was not available. Overall, 98 percent of respondents were reached on a cellular telephone.
The questions were translated into Spanish by ReconMR. Bilingual interviewers began the interview in English and were instructed to follow the lead of the respondent in determining whether to conduct the survey in English or Spanish. Monolingual Spanish-speaking respondents who were initially contacted by English-speaking interviewers were recontacted by Spanish-speaking interviewers. Overall, 18 percent of interviews among respondents who self-reported as Hispanic alone were conducted in Spanish; among the weighted sample, the share is 19 percent among registered voters.
An interview was determined to be complete for the purposes of inclusion in the questions about whom the respondent would vote for if the respondent did not drop out of the survey after being asked the two self-reported variables used in weighting — age and education — and answered at least one of the questions about age, education or presidential-election candidate preference.
Weighting (registered voters)
The survey was weighted by The Times using the survey package in R in multiple steps.
First, the sample was adjusted for unequal probability of selection by stratum.
Second, the Black, Hispanic and non-Black-or-Hispanic samples for Florida, Texas and the rest of the United States were weighted to match voter-file-based parameters for the characteristics of registered voters.
The following targets were used:
• Party (party registration if available in the state; if not, then classification based on participation in partisan primaries if available in the state; if not, then classification based on a model of vote choice in prior Times/Siena polls) by race. The national Hispanic sample was weighted to party by a classification of the strength of the respondent’s partisanship based on a model of vote choice in prior Times/Siena polls
• Age (self-reported age, or voter-file age if the respondent refused) by gender (L2 data)
• Education (four categories of self-reported education level, weighted to match NYT-based targets derived from Times/Siena polls, census data and the L2 voter file)
• Race or ethnicity (L2 model), if part of the non-Black-or-Hispanic sample in Texas and Florida
• White/nonwhite race by college or noncollege educational attainment (L2 model of race weighted to match NYT-based targets for self-reported education), if part of the non-Black-or-Hispanic sample
• Marital status (L2 model)
• Homeownership (L2 model)
• Turnout history (NYT classifications based on L2 data)
• Method of voting in the 2020 elections (NYT classifications based on L2 data)
• State region (NYT classifications), in Florida and Texas
• National region (NYT classifications), outside Florida and Texas
• Metropolitan status (2013 NCHS Urban-Rural Classification Scheme for Counties), if part of the national sample
• History of voting in the 2020 presidential primary (L2 data), if part of the national non-Black-or-Hispanic sample
• Census block group density (A.C.S. 5-Year Census Block Group data), if part of the Florida or Texas non-Black-or-Hispanic sample
• Census block group density of Black residents (A.C.S. 5-Year Census Block Group data), if part of the national or Florida Black sample
• Census block group density of Hispanic residents (A.C.S. 5-Year Census Block Group data), if part of the national or Texas Hispanic sample
• Country of origin (L2 model), if part of the national or Florida Hispanic sample
Third, the sums of the weights were balanced so that each Florida and Texas represented the proper proportion of the national poll and so that the Black, Hispanic and non-Black-or-Hispanic samples represented the proper proportion of each state and the country.
Finally, the sample of respondents who completed all questions in the survey was weighted identically as well as to the result for the general-election horse-race question (including voters leaning a certain way) on the full sample.
Weighting (likely electorate)
The survey was weighted by The Times using the R survey package in multiple steps.
First, the samples were adjusted for unequal probability of selection by stratum.
Second, the first-stage weight was adjusted to account for the probability that a registrant would vote in the 2024 election, based on a model of turnout in the 2020 election.
Third, the sample was weighted to match targets for the composition of the likely electorate. The targets for the composition of the likely electorate were derived by aggregating the individual-level turnout estimates described in the previous step for registrants on the L2 voter file. The categories used in weighting were the same as those previously mentioned for registered voters.
Fourth, the initial likely electorate weight was adjusted to incorporate self-reported intention to vote. Four-fifths of the final probability that a registrant would vote in the 2024 election was based on the registrant’s ex ante modeled turnout score, and one-fifth was based on self-reported intentions, based on prior Times/Siena polls, including a penalty to account for the tendency of survey respondents to turn out at higher rates than nonrespondents. The final likely electorate weight was equal to the modeled electorate rake weight, multiplied by the final turnout probability and divided by the ex ante modeled turnout probability.
Finally, the sample of respondents who completed all questions in the survey was weighted identically as well as to the result for the general election horse-race question (including leaners) on the full sample.
The margin of error accounts for the survey’s design effect, a measure of the loss of statistical power due to survey design and weighting.
The design effect for the full sample is 1.97 for the nationwide likely electorate, 1.48 for the likely electorate in Florida, 1.48 for the likely electorate in Texas, 1.89 for the Black likely electorate and 1.92 for the Hispanic likely electorate.
Among registered voters, the margin of sampling error is plus or minus 2.2 points nationwide, including a design effect of 1.78; 4.6 points in Florida, including a design effect of 1.36; plus or minus 4.5 points in Texas, including a design effect of 1.29; plus or minus 5.4 points for Black voters, including a design effect of 1.81; and plus or minus 4.1 for Hispanic voters, including a design effect of 1.57.
For the sample of completed interviews, among the likely electorate nationwide, the margin of sampling error is plus or minus 2.6 points, including a design effect of 1.93; plus or minus 5.6 points in Florida, including a design effect of 1.64; plus or minus 5.4 points in Texas, including a design effect of 1.5; plus or minus 6.3 points among Black voters, including a design effect of 1.86; and plus or minus 5.2 points among Hispanic voters, including a design effect of 1.96.
Historically, The Times/Siena Poll’s error at the 95th percentile has been plus or minus 5.1 percentage points in surveys taken over the final three weeks before an election. Real-world error includes sources of error beyond sampling error, such as nonresponse bias, coverage error, late shifts among undecided voters and error in estimating the composition of the electorate.


Members of the group Patriot Front ride the subway as a commuter looks on, in Washington, D.C., on July 4.
Cheney Orr/Reuters
hide caption
toggle caption
Cheney Orr/Reuters
The sight of hundreds of masked men roaming the streets of Washington, D.C., on July Fourth weekend, wearing khakis, blue shirts and uniform patches, was chilling to some of the city’s residents.
For many Americans, it was the first they heard about Patriot Front, a white nationalist organization that was born out of the deadly 2017 Unite the Right rally in Charlottesville, Va. A now-viral Reuters photo prompted reflections on the experience of a lone African American woman who was photographed in a Metro subway car, surrounded by white supremacists.
The planned demonstration of force was timed to bring a fringe group of extremists into public view as the nation marked 250 years of its independence. Indeed, the stunt succeeded in earning the group media coverage across mainstream outlets, amplifying its brand and potential to reach new recruits. On this occasion, the members refrained from engaging in violence and property damage, projecting an image of law-abiding, orderly activism.
But those who are closely familiar with Patriot Front’s history and operations warn: Don’t believe what you see.
“That is not who they are in private,” said Len Kamdang, director of the Criminal Justice Project at the Lawyers’ Committee for Civil Rights Under Law. “Although they were on their best behavior [last] weekend, this is a dangerous group that commits acts of violence all over the country.”
Patriot Front’s history of violence and property damage
Kamdang’s organization sued members of Patriot Front for vandalizing a public mural dedicated to the tennis legend and Black activist Arthur Ashe in Richmond, Va., in 2021. Ashe, who was inducted into the International Tennis Hall of Fame in 1985, was born in Richmond and his legacy is a continuing source of pride to members of that community.
“A couple of Patriot Front members showed up under cover of night and vandalized the mural,” Kamdang said. “They painted white stencils all over. … They literally tried to whitewash him and they put their symbols of hate all over — their stencils, their slogans. And all the while they were caught on video. And that video leaked using some of the most horrible language that you can imagine.”
In many jurisdictions, law enforcement can seek additional hate crime charges or sentencing enhancements in cases where illegal acts appear to have been motivated by racial bias. But in this case, Kamdang said, Patriot Front members faced no criminal charges and their identities were only revealed when online activists later infiltrated the group and leaked internal records.

In another civil case, Patriot Front was ordered to pay almost $2.76 million to an African American musician whom they assaulted in Boston in 2022, at another July flash rally they staged. Despite a police detective concluding that the attack “appeared to be more likely than not motivated in whole or in part by Anti-Black bias,” nobody was criminally prosecuted.
Neo-Nazi ideology in patriotic colors
In 2020, Kristofer Goldsmith said that a fellow veteran invited him to partner up on infiltrating Patriot Front. Goldsmith, who later established the Task Force Butler Institute to recruit Army veterans to counter fascist groups through open source online research, was not closely familiar with the group at the time.
“Frankly, when my friend used the term ‘neo-Nazi,’ I thought he was using hyperbole,” Goldsmith said. “It wasn’t until I saw them doing things like debating the merits of national socialism versus fascism versus monarchy that I truly understood that neo-Nazi was not hyperbole, that these people actually praise Hitler. … These people have dedicated their lives to promoting white nationalist, fascist and genocidal ideology.”
Patriot Front’s founder, Thomas Rousseau, was formerly a leader of a group called Vanguard America, which was prominent in planning and a presence at the 2017 Unite the Right rally. That gathering, the largest public white nationalist event in generations, turned fatal when one extremist drove a car through a crowd of counterprotesters, killing Heather Heyer. Ultimately, Goldsmith said that rally further smeared public perception of the white nationalist movement as violent and un-American — lessons that Rousseau took to heart.
“Rousseau needed to rebrand Vanguard America,” Goldsmith said. “So he basically stole all of its assets, its digital assets … and made it into Patriot Front and literally painted everything in red, white and blue so that it would be more attractive.”
The group has also shown up at natural disaster sites, namely in Central Texas last summer, ostensibly to assist local residents. Goldsmith said these missions and the group’s outward aesthetic are meant to project an idea of patriotism and service. He said the group maintains a strict code of conduct. Among other things, they do not display swastikas or give Hitler salutes in public.
“The goal of their propaganda, of their public actions like this, is to beat MAGA and conservatives and Republicans into defending them and to saying, ‘I don’t see anything wrong with this group. They clearly love America,’” he said.
Patriot Front described as a “cult” and a “pyramid scheme”
The show of force in D.C. has raised questions about the group’s financing, and whether members’ travel was sponsored by outside individuals or groups. In fact, Goldsmith and Kamdang said that members of Patriot Front appear almost entirely to shoulder the cost of operations and Rousseau’s lifestyle. They said it’s most likely that those who traveled to D.C. had to cover their costs themselves.
“All of them funnel resources to the top,” Kamdang explained about the group’s general financial structure. “In order to be a Patriot Front member, you have to engage in acts of what they call ‘activism.’ And usually what that means is vandalism: putting up banners, spreading the slogans of hate all over the country. And in order to do that, they will have stickers, stencils, branding. All of that has to be approved from the top down, and all of it has to be purchased from the top down. So all the members who do this multiple times a month send cash to Thomas Rousseau for essentially stickers and stencils.”
Goldsmith said that from his time infiltrating the group, the costs could run up to hundreds of dollars a month per member. Kamdang, who said that attorneys are actively seeking to collect judgment in the settlement over the Arthur Ashe mural, noted that Rousseau appears not to hold any additional paying jobs.
“This seems to be what he’s doing full time,” Kamdang said. “So he appears to be being propped up full time by his members.”
Goldsmith likened the financial operation to a pyramid scheme. But he said even more substantial than the financial investment that Patriot Front members are required to make to retain membership is the control they give up over their time and personal choices.
“I describe it as a cult, not to be offensive, but because it is like Rousseau needs to have complete control of all of his members,” Goldsmith said. “[The group] requires its members to give up all of their lives, all of their relationships. All of their priorities in life need to be focused towards growing the organization or continuing the organization [and] enriching its leadership. So, it’s costly.”
NPR reached out to Patriot Front for comment. The group did not respond by deadline.
Goldsmith also noted that Rousseau often gives lengthy speeches that members are expected to listen to, via online platforms.
To Kamdang, the publicity that Patriot Front earned through the group’s D.C. stunt presents a danger: It amplified a presentation of the group that was deliberately crafted to make Patriot Front appear orderly and patriotic.
“I think the reason why it got a lot of attention is because Patriot Front was very careful in their language,” he said. “They try to mask their replacement theory, the white supremacy and in ‘Americana’ terms and patriotism. But that is not who these guys are.”
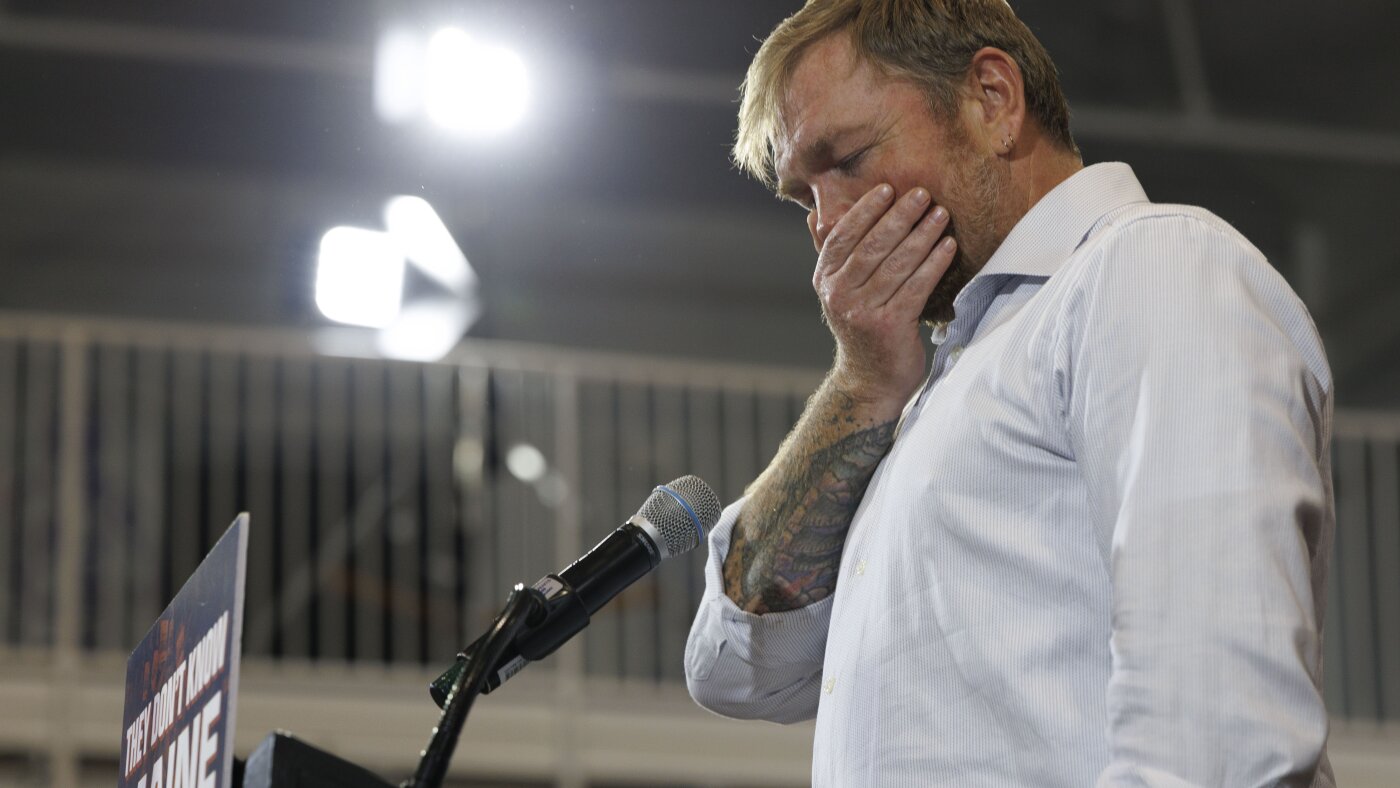
Now-former Democratic Senate candidate Graham Platner speaks at his primary election night event on June 9 in Blue Hill, Maine. Platner officially dropped out of the race July 10 following rape allegations from a former romantic partner that he denies.
CJ Gunther/Getty Images
hide caption
toggle caption
CJ Gunther/Getty Images
Graham Platner, Maine’s Democratic nominee for Senate, is officially out of the race.
The Maine Secretary of State said Platner filed the necessary paperwork to withdraw his candidacy two days after he announced he planned to do so following an accusation of rape by a former romantic partner. Platner denies the allegation.
The Maine Democratic Party has until July 27 to pick Platner’s replacement.
In his withdrawal notice, Platner said “people are desperate for change” and that’s why they voted “for a new kind of politics” by making him the Democratic nominee. He expressed gratitude for those who supported his campaign and said that he will continue to fight for “the movement we have built together and the future we believe in.”
He ended his notice with a strong statement aligned with the progressive platform.
“F*ck ICE. Free Palestine. Up the Hearts.”
Platner announced his plan to withdraw from the race in an 11-minute video he posted to social media on July 8. He said he had no choice but to suspend his campaign, citing it was no longer viable financially.
“We are going to lose our ability to fundraise. We are going to lose our ability to access voter data. We are going to lose all of the things that any campaign needs on the basic level simply to function,” he said.
Platner added that dropping out was not an admission of guilt. Rather, the decision, he said, is to keep the progressive movement in Maine alive to defeat Republican Sen. Susan Collins in November. Platner blamed the “political establishment” for his downfall and argued the goal was to force him out of the race.
“We built a campaign. We engaged in electoral politics. We motivated people. We banded together. We did it the way that we were told we are supposed to make change and we won. And now they are not going to let us have it. Not if it’s me,” he said.
Many powerful Democrats and progressives, including Sen. Bernie Sanders, an independent, urged Platner to step down.
Platner has had to answer to a waterfall of scandals since he launched his Senate bid. Despite those, he ran away with the nomination in the June 9 primary, securing more than 150,000 votes — more than any other Democratic Senate candidate in Maine’s history.
Platner ran on a progressive platform centered on affordability, universal health care and getting corporate money and influence out of politics. During his campaign, he generated an undeniable amount of enthusiasm, something the Maine Democratic Party will have to harness if it hopes to beat Collins in the general election.
Multiple people have already launched campaigns to replace Platner, including former state Sen. Troy Jackson and former CDC official Nirav Shah, who both ran unsuccessful bids for governor.
Platner called on the replacement process to reflect “the Mainers who on June 9 turned out and showed that they are desperate for a different kind of politics.”
“We were asking for real democracy, and we did it the right way. And we won. But now the ball is in the court of the Democratic establishment,” he added.
The Maine Democratic Party said that it intends to hold a new nominating convention where around 600 delegates will select Platner’s successor. Candidates have until July 15 to declare their intent to seek the nomination and gather signatures from at least 8 of Maine’s 16 counties. Party leadership added they will make the nomination process public and transparent.
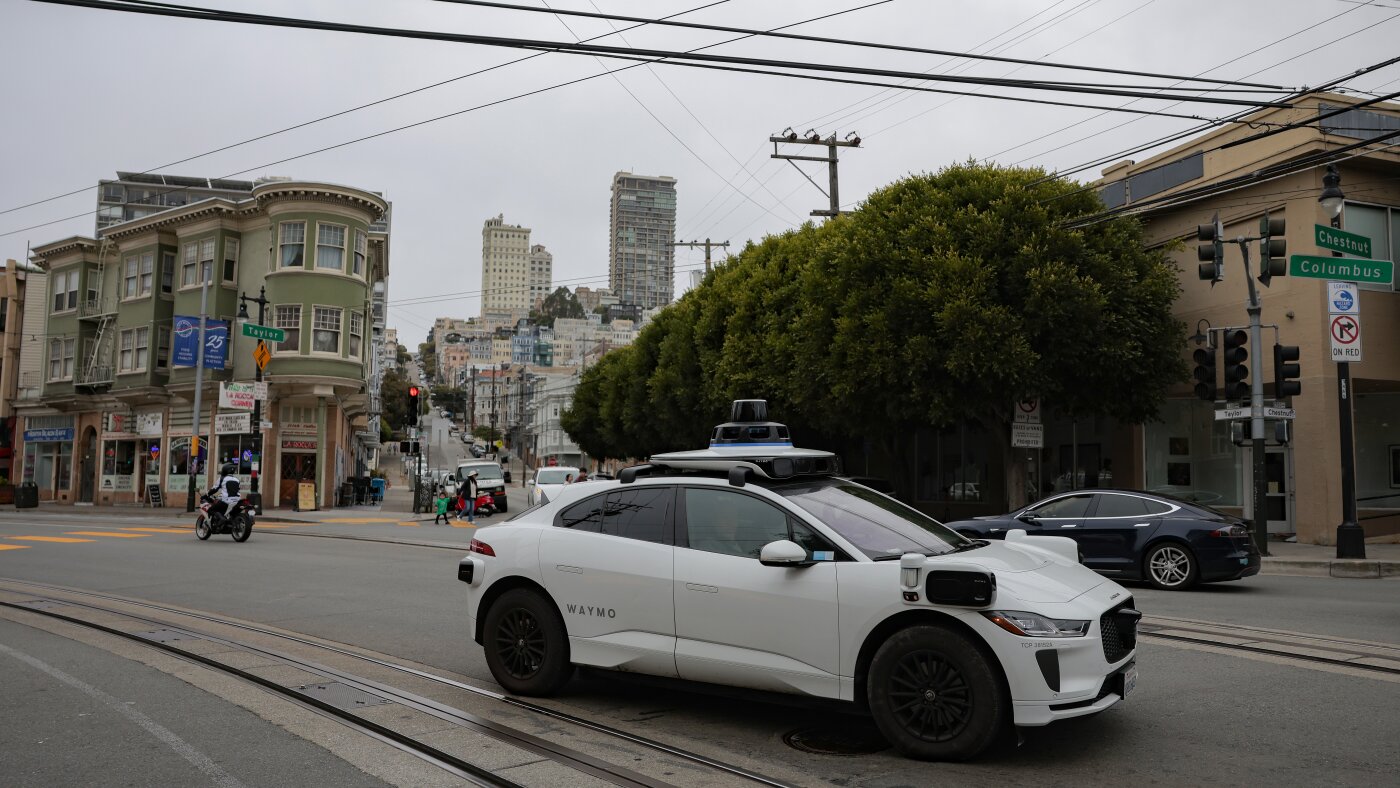
A Waymo robotaxi drives in San Francisco’s North Beach neighborhood this week.
Heather Diehl/Getty Images
hide caption
toggle caption
Heather Diehl/Getty Images
Police in San Mateo, Calif., posted Monday on social media that they had apprehended a pair of teenagers from a Waymo driverless robotaxi after the company alerted authorities to suspected criminal activity. It’s the latest incident involving video surveillance of passengers and others by autonomous vehicles — raising questions about the limits of privacy in such vehicles.

The Facebook post by the San Mateo County Police said: “Parents do you know where your teens are? @waymo does!”
The 15-year-olds were allegedly drinking alcohol and shooting toy guns from the car, according to the police. They said Waymo’s systems detected behavior that then triggered a safety response, after which the company disabled the vehicle and contacted police.
Waymo’s cars, equipped with an array of cameras, microphones and other sensors to monitor passengers and other nearby vehicles, are becoming more common in cities across the United States. Experts say the detention of the two teens in San Mateo highlights a potential — but not inevitable — trade-off between privacy and convenience. It also questions the extent to which companies similar to Waymo are required to hand over private data, including audio and video of passengers, in situations where a crime is suspected.
NPR reached out to Waymo, which is owned by Alphabet, the parent company of Google, for comment on the details of the San Mateo incident and how the company responded, but did not hear back. But on its website, the company says that as many as 29 cameras in its autonomous cars provide an all-around view and “are designed with high dynamic range and thermal stability, to see in both daylight and low-light conditions, and tackle more complex environments.”
“There already exist laws that govern duty to report or even duty to protect” for carriers such as Waymo, according to Alessandro Acquisti, a professor of information technology at the MIT Sloan School of Management. “The privacy problems arise when and if driverless carrier companies used such laws or ethical obligations as a pretext for blanket, indiscriminate accumulation of identifiable data for unspecified future purposes.”
That includes not just monitoring people inside the cars, but outside too. Take, for example, a hit-and-run investigation last year in Los Angeles. Media reported that the police inquiry was aided by video captured by a Waymo taxi that had a clear view of the crime. Critics suggested at the time that authorities were using the company’s vehicles as a mobile surveillance platform. And during 2025 protests in Los Angeles against Immigration and Customs Enforcement crackdowns, demonstrators vandalized Waymos, apparently angry that video recorded by the vehicles could be used by police, although there is no evidence that happened.
In a transparency report, Google says it received nearly 290,000 requests from governments worldwide in the first six months of 2025 for disclosure of user information across all its platforms, including Waymo. The company says that in more than 80% of the requests in those six months, some information was disclosed. “Google carefully reviews each request to make sure it satisfies applicable laws. If a request asks for too much information, we try to narrow it, and in some cases we object to producing any information at all,” the company says.
In an email to NPR, San Mateo Police Department spokesperson Jeanine Luna said that detaining the teens in the Waymo on Monday was “wholly appropriate” under the circumstances. “We received the call of a ‘firearm’ being shot from a moving vehicle,” she said. “Furthermore, the occupants were described as being possibly ‘intoxicated.’” she said.
“Being that the vehicle was disabled (the occupants had every right to exit the vehicle before police arrival, but they did not), a high-risk traffic stop was conducted to ensure the safety of all involved,” Luna added. “They were not arrested and were released to their parents, however, potential charges are still pending dependent on what the video from inside the vehicle shows.”
Autonomous taxis represent an ethical gray area
Robotaxis began to roll out across the U.S. in December 2018, when Waymo launched in Phoenix. These services have been used for less than a decade — so the norms surrounding them aren’t settled, experts agree.
The Facebook post may make Waymo passengers wonder what triggers a police intervention, says Irina Raicu, director of the Internet Ethics program at Santa Clara University. She has used Waymo’s driverless taxis and says ethically, the privacy issues surrounding them sit in a gray area. “There’s something about being in a car without another person that makes you think it’s private.”
“With all these recording devices, we don’t see them, [and] they’re not these obvious things being stuck in our faces,” Raicu adds.
That brings up a key issue: informed consent, Acquisti says.
“It is not clear the extent to which passengers … are reminded that when they step into the car, that they are being monitored, and most likely they are not told in its entirety how the data will be used,” he says.
Bruce Schneier, a cybersecurity and privacy expert and professor at the Munk School at the University of Toronto, believes that Waymo does have a compelling interest in protecting its vehicles. He compares monitoring a robotaxi via cameras to a human taxi driver keeping an eye on passengers in the rearview mirror.
“Maybe the driverless car comes back … and it has all of its cushions slashed, and it’s like, ‘Who the hell did that? Let’s go and look at the tape,’” Schneier suggests. “You can’t have sex in the back of a taxi, right? Someone would say, ‘Stop it.’”
He concludes that some supervision makes sense. In an Uber rideshare, he notes, “most of the time there’s a camera recording the back seat.” (Uber says on its website that it allows drivers to install such cameras for the purpose of “fulfilling transportation services.”)
Waymo robotaxis, while a fairly common sight in the San Francisco Bay Area, are still a novelty in much of the country. And many people are hesitant to ride in one, according to a Pew Research Center poll published this month. The survey found that only 5% of Americans had ever ridden in a driverless car. Meanwhile, 71% of those polled said they would feel uncomfortable in one, with only 7% saying they would be “extremely or very comfortable” riding in one.
For that reason, experts who spoke with NPR said they were optimistic that it’s not too late to shift gears on privacy norms and policies surrounding these vehicles.
Acquisti doesn’t see why privacy measures can’t be built into driverless vehicles.
“I would immediately challenge the notion that people have to be monitored,” he says, noting that privacy-preserving technologies exist and can be installed.
“Driverless cars are coming, but they don’t have to come in this particular incarnation,” Raicu says. “They’re still being designed and redesigned. It’s early days.”
-
 Lifestyle17 minutes ago
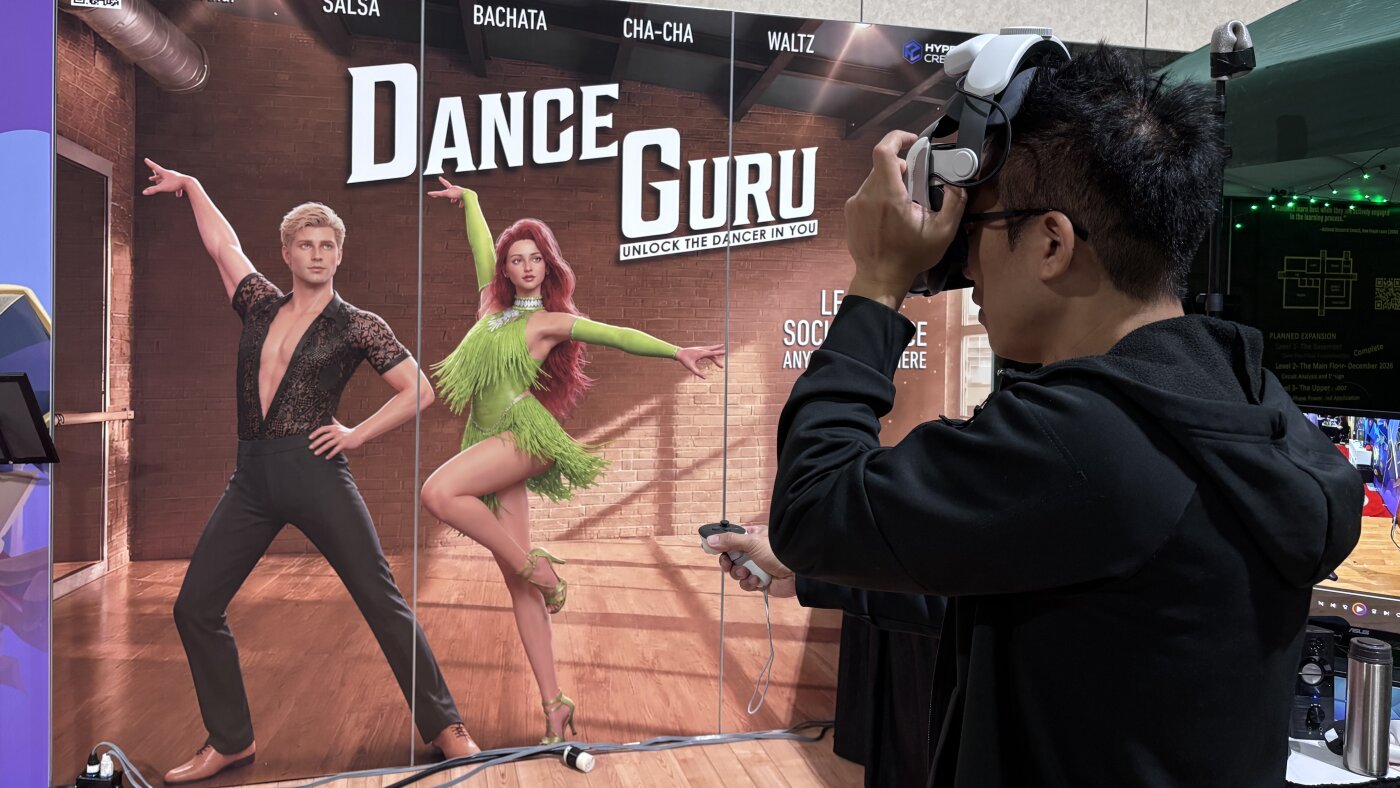
Shy on the dance floor? Virtual reality ‘partners’ aim to help you find your groove
-

 Technology29 minutes ago
Are you filthy enough for a $700 portable shower?
-

 World31 minutes ago
Former British MP and reality TV star Ann Widdecombe found dead; man arrested for murder
-

 Politics37 minutes ago
Trump takes unusual step, lets bipartisan housing bill become law unsigned amid SAVE pressure campaign
-

 Health44 minutes ago
Eating common dairy food every day may slow biological aging, study suggests
-

 Sports47 minutes ago
CM Punk to defend Undisputed WWE Championship against Cody Rhodes at SummerSlam
-

 Technology52 minutes ago
Would you pay $8,000 for a robot to fold laundry?
-
 Business59 minutes ago
Legendary Television City may be be sold in further blow to Hollywood