News
Visa program draws foreign teachers to a rural Alaska school district facing a staffing crisis

Due to the success of the State Department’s J-1 Visa program, the Kuspuk School District and other rural districts in Alaska are looking at ways to utilize other visa programs to keep foreign teachers in classrooms for longer.
Emily Schwing for NPR/Emily Schwing
hide caption
toggle caption
Emily Schwing for NPR/Emily Schwing
When special education teacher Dale Ebcas moved from his home in the Philippines to the tiny village of Upper Kalskag in Alaska back in the winter of 2020, the warmest layer he brought with him was a trench coat: “I was imagining a weather like, you know, Korea,” he laughs. “Because I’m a fan of watching Korean movies and it’s like, ‘oh, they’re just wearing trench coats… it seems like it might work’.”
The average temperature in the Philippines’ coldest month is just about 78 degrees Fahrenheit. By contrast, the climate in Upper Kalskag is semi-arctic and snow can blanket the ground for more than half the year.
Needless to say, the trench coat didn’t cut it – Ebcas had to borrow a down jacket from the principal of the school where he’d been hired.
His school district – the Kuspuk School District in Western Alaska – is about the same size as the state of Maryland. While the region is large, the student population is small: only 318 kids spread out across seven villages and none are connected by a road system. Here, like in many other rural school districts across America, it’s a struggle to fill nearly 40 teaching positions. That’s why the Kuspuk School District is bringing in educators like Ebcas from over 5,000 miles away – so many of them, in fact, that they now make up more than half the district’s teaching staff. It’s one of many school districts around the country who are addressing a shortage of teachers by relying on special visas that allow foreign teachers to come work in the U.S.
Ebcas is from Cagayan de Oro City, on the Philippine island of Mindanao – an island with a population of more than 26 million people. By contrast, there are just over 200 people in Upper Kalskag. While winters are long and the community is tiny, Ebcas says he enjoyed teaching in Alaska so much that he encouraged other teachers he knew from the Philippines to join him.

Second grade teacher Vanissa Carbon said that the adjustment to winter in Alaska took some patience. “Oh my God, it’s so long,” she laughed. But she appreciates the community in Upper Kalskag for its similarities to Filipino culture.
Emily Schwing for NPR
hide caption
toggle caption
Emily Schwing for NPR
His aunt, Vanissa Carbon, now teaches second grade in Upper Kalskag. Although she says the winter in Upper Kalskag is long, she’s been pleasantly surprised by life here, where the population is predominantly Indigenous. “The people here are also like Filipinos – their culture is somehow the same in terms of close family ties, being together on occasions and helping each other,” says Carbon.
In the Kuspuk School District, teachers who come from the Philippines say they can make 15 times the amount of money they could at home, in addition to benefits. And they have access to teaching tools and technologies that aren’t as readily available in the Philippines.
“I was quite fascinated with the fact that we have resources that are really readily accessible to students with special needs,” Ebcas says. He points to tools like a ‘talking pen,’ which assists students in learning to read, among other technologies. “These kinds of devices, we don’t have them in the Philippines. … It’s very expensive,” he says.

Dale Ebcas is from one of the most populated islands in the Philippines. He travelled more than 5,000 miles to teach special education at an elementary school in the village of Upper Kalskag, Alaska. Just over 200 people live there.
Emily Schwing for NPR
hide caption
toggle caption
Emily Schwing for NPR
Aguillard did her PhD research on the special education system in the Philippines. She says the requirements for students working toward teaching degrees there aren’t so different from what’s required in the U.S. “Their studies were purely 100 percent based on the U.S. model of students receiving special education services.” She says her research was in the back of her mind when her school district opted to pursue hiring foreign teachers.
Both Ebcas and Carbon are here on J-1 visitor visas, which are good for three years and can be extended for two more. The J-1 is a cultural exchange visa, and J-1 Visa holders often fill summer service positions related to the travel industry in Alaska. Childcare workers, including au pairs, also use J-1 Visas. Nationwide, there are more than 5,700 teachers in the US on J-1 Visas, according to the State Department. 91 of them are in Alaska.
“They do have program requirements where they do have to share not only their culture, but also learn about the culture that they are immersed in for their job,” says Superintendent Aguillard. “A big part of education in rural Alaska specifically is the emphasis on cultural heritage and keeping that culture alive, whether it be Alaska Native culture, or whatever culture an individual brings with them to the space they’re in,” she says.
She says the teachers host Filipino-themed events in her school district. “A couple of our teachers have put on informative nights about the Philippines, so they’ll decorate the whole gym, they’ll cook food and do a lecture on Filipino cultural traditions,” she says.
Aguillard says J-1 Visas have had a dramatic positive impact in the Kuspuk School District. “We went from having zero applicants for positions for a year-long posting to over 100 applicants of extremely qualified people with experience and they’re wanting to come teach our students.”
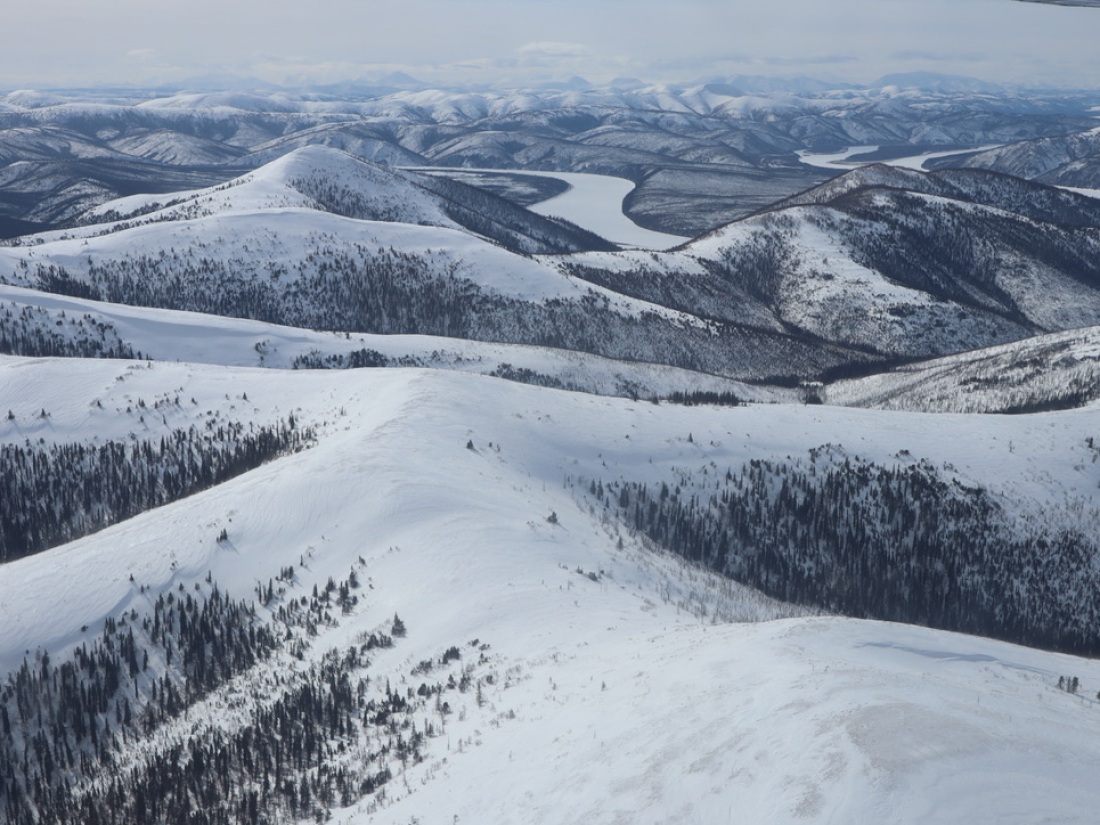
Alaska’s Kuspuk School District serves 318 students spread across a rural region equivalent to the size of the state of Maryland.
Emily Schwing for NPR
hide caption
toggle caption
Emily Schwing for NPR
Still, she says the teacher shortage is so dire that 20% of teaching positions at her schools were never filled this year – even with the teachers on J-1 Visas. Now the Kuspuk School District is looking at ways to keep foreign teachers on staff for more than five years. One option is the H-1B Visa – a specialty occupation visa that paves the way for immigration.
Kuspuk isn’t the only remote school district in Alaska utilizing state department visas to fill teaching positions. More than 350 miles south, the Kodiak Island Borough School District administration has hired an immigration lawyer to secure H-1B Visas and they’re also recruiting teachers in the Philippines.
At an Alaska Senate Finance Committee hearing in March, Kodiak Island Borough School District Superintendent Cyndy Mika said the district now hosts its own job fair there. “This year, we went to both Manila and Cebu city,” she said. “We went to Cebu, because it’s rural remote and we knew that those are the types of teachers that would be better integrated into our community.”
In Upper Kalskag, Dale Ebcas extended his J-1 Visa for two additional years, but at the end of the next school year, his time in Alaska will run out as well. He’s won a number of awards for his work in Upper Kalskag, and is also among 20 teachers recognized in Alaska as a 2024 Educator of the Year.
He says it’s a disappointing reality of the J-1 Visa program that he can’t stay on to build on the work he’s already done. “I could have continued the things I do with the community and the kids, if only I could go beyond five years,” he said. “I consider this already as my family, the community here, the kids here.”

Why are there so many Greeks in Tarpon Springs, Fla.? Because in the early 1900s, Greek sponge divers came from the Dodecanese islands and revolutionized the sponge industry on Florida’s gulf coast.
What explains the pockets of Portuguese and Cape Verdeans in New Bedford, Mass.? In the 1800s, winds pushed whaling boats east to the Azores and Cape Verde, where experienced whalers joined the crews.
There’s the Basque population in Boise, Idaho, whose ancestors traded a mountainous region between France and Spain for the American West in the hopes of finding gold but later turned to sheep herding. There are the families of Yemeni immigrants hired by Ford Motor Company to build cars in Detroit, and the Vietnamese refugees who were resettled near New Orleans and Houston, where they could carry on shrimping.
These stories are everywhere on this map of American ancestry, which shows how people described their backgrounds to the Census Bureau. There are nearly 200 unique identities represented; blend them — as 340 million Americans do — and we arrive at a jumbled, overlapping, story-filled infinity.
Much of what we see is a history of immigration. Over 250 years, the country has absorbed more than 100 million people. We can trace the pressures that pushed and pulled them here — and the policies that welcomed certain groups while keeping others out — through the patterns in where their descendants live today.
Now, a larger share of the country was born abroad than ever before, and the Trump administration’s sweeping immigration bans echo exclusionist policies enacted in response to similar demographic conditions a century ago.
Those policies defined Americans for generations. Recent efforts to limit immigration will likewise affect how future Americans understand their heritage and themselves.
How we got here
In the late 1700s, the area that would become the present-day United States was already diverse. At least 1.5 million Native people, and possibly many more, were living across the territory. They were joined by about three million Europeans and enslaved Africans living in both the English colonies and the French and Spanish territories.
From colonial times, immigration was an important contributor to population growth. It accelerated as the new country’s territory expanded west and immigrants arrived to settle it. From 1820 to 1860, more than five million people came, through a mostly open door.
With the advent of the steamship, the cost of passage plummeted, and companies offered special immigrant fares that were often coupled with rail tickets to the interior of the country. Once a community of immigrants was established somewhere, it tended to grow.
After 1840, immigration from Western Europe began to rise quickly as political instability in Germany and the famine in Ireland drove people to leave. Asian immigrants, drawn by the discovery of gold in California in 1848, were recruited to work on farms and railroads.
Later in the 19th century, pogroms across Eastern Europe and the aftermath of Italian reunification drove a surge of migration to the United States. From 1880 to 1920, 24 million immigrants arrived. They went almost everywhere except the South, where the land-owning elite already had cheap labor from the formerly enslaved and poor tenant farmers.
Cities swelled. In 1910, according to the Ellis Island National Museum of Immigration, three-quarters of the residents of Boston, Chicago, Cleveland, Detroit and New York City were immigrants or children of immigrants.
1850
2 million total immigrants
The 1850 census did not include data on the birthplace of enslaved people.
1910
14 million total immigrants
1970
9 million total immigrants
2024
50 million total immigrants
Many rural areas in the Midwest had a similar share of immigrants in 1910, but newcomers to the cities tended to be from novel sources like Russia or Italy. That meant there were more languages, more cuisines and more workers. It also meant there were more crowds, more slums and more people behaving in unfamiliar ways — fodder to drive views that the new immigrants were unassimilable and that policies were needed to keep them out.
The first federal law to severely limit immigration had come much earlier, in 1882, when practically all Chinese people were barred from entering the country. More restrictions followed, and eventually animosity toward new immigrants led to the passage of laws in the 1920s creating a quota system tied to nationality.
Western Europeans were given generous quotas and Southern and Eastern Europeans much smaller ones. For the rest of the Eastern Hemisphere, the quotas were set to almost nothing. Ships raced through the night to reach New York Harbor, all trying to be first to dock at Ellis Island.
There weren’t quotas for countries in the Americas and the Caribbean, but there were other restrictions. Mexicans faced mass deportation campaigns in the 1930s and 1950s, even as millions were recruited as temporary workers to fill agricultural jobs across the Southwest.
Over the next 40 years, these rules drove the foreign-born population in the United States to its lowest levels. Children of immigrants replaced immigrants, blending into American society while retaining their own cultural traditions.
Then, alongside the civil rights movement of the 1960s, activists and lawmakers who saw the national quota system as racist pushed to replace it with one based on employment and family ties.
Another decades-long wave of immigration followed, this time from different parts of the world.
Chart data is unavailable.
Share of immigrants in the United States by region of birth
The new rules allowed people to sponsor their family members and relatives, and they gave preference to workers with advanced degrees and specialized skills. The family visas, in particular, led to an unforeseen boom in immigration.
An expanded refugee program also brought more immigrants, many from Southeast Asia who were displaced by Cold War conflicts.
For the first time, immigrants from the Western Hemisphere faced limits on their numbers. Similar to the European workers who arrived earlier in the century, many chose to settle in the United States permanently instead of risking returning to their home countries between periods of working in the United States. Millions who couldn’t get visas turned to entering illegally.
The most recent immigration wave, during the Biden administration, was different still: The number of visas for immigrants remained steady, while migrants from Central America arrived at the southwest border in large numbers to seek asylum. Desperate conditions in Cuba, Haiti and Venezuela, as well as wars in Afghanistan, Ukraine and elsewhere led hundreds of thousands of people to flee to the United States — many of them drawn to established communities of immigrants from their countries.
Where we are today
The lines of American ancestry today are not neatly drawn, and groups overlap and spill into one another. Some people don’t answer the census questions about their origins at all. For others, it’s complicated. Descendents of enslaved people, for example, may identify themselves as African American because they are unable to trace their roots to a specific place.
Many areas have truly mixed populations, with people of several different ancestries nearly equally represented.
Take this area just southwest of Houston, for example:
Nigerian, Jordanian, Mexican, Vietnamese, African American, Salvadoran, Iraqi, German, English, Irish and Chinese people are all among the top groups in these neighborhoods.
Every city has its own distinct pattern, visualized in the the patchwork of gold, green and blue in Los Angeles, the stark reds, blues and yellows of Chicago, a purple Minneapolis, a green Honolulu:
Who comes next?
If the patterns in these maps reflect the immigration policies of at least a century ago, we can expect them to shift and change again as a result of contemporary decisions about who makes up the American mosaic.
No comprehensive immigration legislation has passed Congress since the 1980s. After a surge of immigration during the Biden administration, in which an estimated eight million people entered the country over three years, demographic experts now estimate that the United States could reach net-zero or negative immigration sometime soon. That is in part because of the Trump administration’s aggressive actions to speed deportations of people who are in the country illegally and to limit pathways to legal immigration.
At the same time, the factors that pull immigrants to the United States remain strong. And, unlike 100 years ago, the country now faces a declining population and work force. The tension between the need for new workers and resurgent nativist politics will influence who comes, who settles and who is counted among the ancestors of future generations.
About the data
The ancestry maps in this article and the related interactive map draw from seven tables of race, ethnicity and ancestry data that the Census Bureau published as part of the American Community Survey estimates for 2019-2024.
The census ancestry and origin data are estimates based on a sample of the population and include margins of error that can be large for small population groups. We used the estimates published by the Census Bureau without adjustment.
In the survey, respondents are asked questions about their race and whether they are of Hispanic or Latino origin. Each of those questions allows respondents to list their national origins. An additional question asks about their ancestries. People can claim multiple ancestries or origins and appear in multiple categories.
Some groups appear in multiple tables. For example, people can select “white” as their race and list “German” as a specific origin. Separately, anyone can also choose “German” in response to the survey’s ancestry question. For such groups, we used the table with the higher value for the country as a whole. In a small number of cases, similar ancestries were grouped together.
Colors for each census tract are blended based on the adjusted number of people who reported being of each race and ancestry in the tract, for each group above a minimum threshold.
In charts of the immigrant population, counts come from Census Bureau research publications, the 2000 census and the American Community Survey. Those counts include only foreign-born residents and exclude any descendants born in the United States.

Former Federal Election Commission Chairman Trevor Potter testifies during a Senate Rules and Administration Committee hearing on artificial intelligence and the future of elections on Capitol Hill in Washington, D.C., Sept. 27, 2023.
Drew Angerer/Getty Images
hide caption
toggle caption
Drew Angerer/Getty Images
The Supreme Court struck down limits on how much political parties can spend in coordination with their candidates in a 6-3 decision split along ideological lines. The ruling is the latest in a series of Supreme Court decisions that have loosened campaign finance restrictions, overturning a 2001 precedent that upheld the spending limits.
Former Federal Election Commission Chairman Trevor Potter, who now serves as president of the Campaign Legal Center, joined NPR’s Morning Edition to break down the ruling. Speaking to NPR’s Michel Martin, Potter discussed why the court reversed its earlier precedent, how the ruling changes campaign finance rules and whether greater transparency could address concerns about corruption.
Listen to the full interview by clicking on the blue play button above. And read takeaways from the conversation below.
The post-Watergate limits were meant to prevent corruption
Potter said they were designed to stop donors from routing large contributions through national party committees to directly fund a favored candidate’s campaign. The restrictions were intended to prevent “an obvious way around” campaign contribution limits.
The court previously upheld the same limits
Asked why the Supreme Court upheld the law about 20 years ago, Potter said the justices concluded the restrictions were a constitutional way to prevent corruption. He said the court viewed them as an “anti-circumvention measure” to stop donors from using political parties to bypass contribution limits.
Potter rejects the majority’s rationale
Potter rejected the majority’s view that political parties have less political power than outside groups, saying earlier Supreme Court decisions allowing unlimited outside spending created that imbalance. He pointed to Justice Elena Kagan’s dissent in support of that argument.
Disclosure wouldn’t necessarily reveal private fundraising arrangements
Potter said disclosure alone would not address his concerns because it cannot reveal private agreements between candidates and donors. While campaign donations to political parties are public, he said voters would not see behind-the-scenes requests from candidates asking donors to contribute to party committees that later support their campaigns.
“We’re never going to see that,” Potter said. “I don’t think there’s a way to practically disclose those backroom deals.”
This interview was written for the web by Majd Al-Waheidi and edited by Treye Green.

A woman suffered several injuries but survived falling 1,500 feet down California’s Mount Shasta on Sunday, officials said.
The climber, 31, was attempting to ascend the mountain, which is technically a stratovolcano with the second-highest peak in the Cascades, according to the U.S. Forest Service. She was climbing in a group of three novices at an elevation of around 13,000 feet when she fell.
She suffered a suspected ankle fracture and “additional injuries consistent with the significant fall,” although she was found alert and “in good spirits,” the forest service said. Officials haven’t identified the climber.
Efforts to locate and rescue the woman got underway at around noon on Sunday and involved three climbing rangers from the forest service as well as members of the California Highway Patrol. An initial helicopter search was limited because of cloud cover on the mountain, the forest service said, prompting one ranger to ascend a portion of the mountain on foot to reach her. One member of the woman’s climbing party helped carry rescue equipment, as did a fourth climber who stopped to assist.
California Highway Patrol safely removed the woman from the mountain at around 5:30 p.m., and she was eventually taken to Mercy Medical Center Mount Shasta for medical care, according to the forest service.
The agency said the woman’s fall “serves as an important reminder that Mount Shasta is a high-altitude mountaineering environment, not a hike,” and “experienced climbers can encounter rapidly ranging weather, steep snow and ice, rockfall, and hazardous fall conditions.”
It also encouraged prospective climbers to “be honest about your experience and physical conditioning” before attempting to summit the mountain.
The woman and her climbing party were ascending Mount Shasta along a route called Avalanche Gulch, which “is steep and rigorous requiring crampons, a mountain axe, helmet, and basic snow travel skills,” according to the Mount Shasta Avalanche Center. It takes climbers up a 7,000-foot vertical ascent that features “steep snow and ice, rock fall, and weather extremes,” the center said.
-

 Pennsylvania2 minutes ago
Pennsylvania State Police trooper killed in crash along Interstate 81
-

 Rhode Island7 minutes ago
‘Real Housewives of Rhode Island’ star Liz McGraw exits show after one season
-

 South-Carolina14 minutes ago
South Carolina Lottery Powerball, Pick 3 results for July 1, 2026
-

 South Dakota17 minutes ago
Families celebrate 250th in South Dakota
-

 Tennessee22 minutes ago
Parasite-induced ‘explosive’ diarrhea cases rise in Tennessee. Here’s what to know
-

 Texas29 minutes ago
New date set for opening of Six Flags Over Texas’ Tormenta Rampaging Run coaster after delay
-

 Utah32 minutes ago
Wasatch Front cities running out of water called a ‘myth’
-
Vermont37 minutes ago
VT Lottery Powerball, Gimme 5 results for July 1, 2026

